

Question: PART 1 Calculate a correlation coefficient for these relationships using the Pearson statistic. Report all significant and non-significant relationships in A P A style. For
PART 1
- Calculate a correlation coefficient for these relationships using the Pearson statistic.
- Report all significant and non-significant relationships in A P A style.
- For each scatterplot, include the grouping variable of Gender.
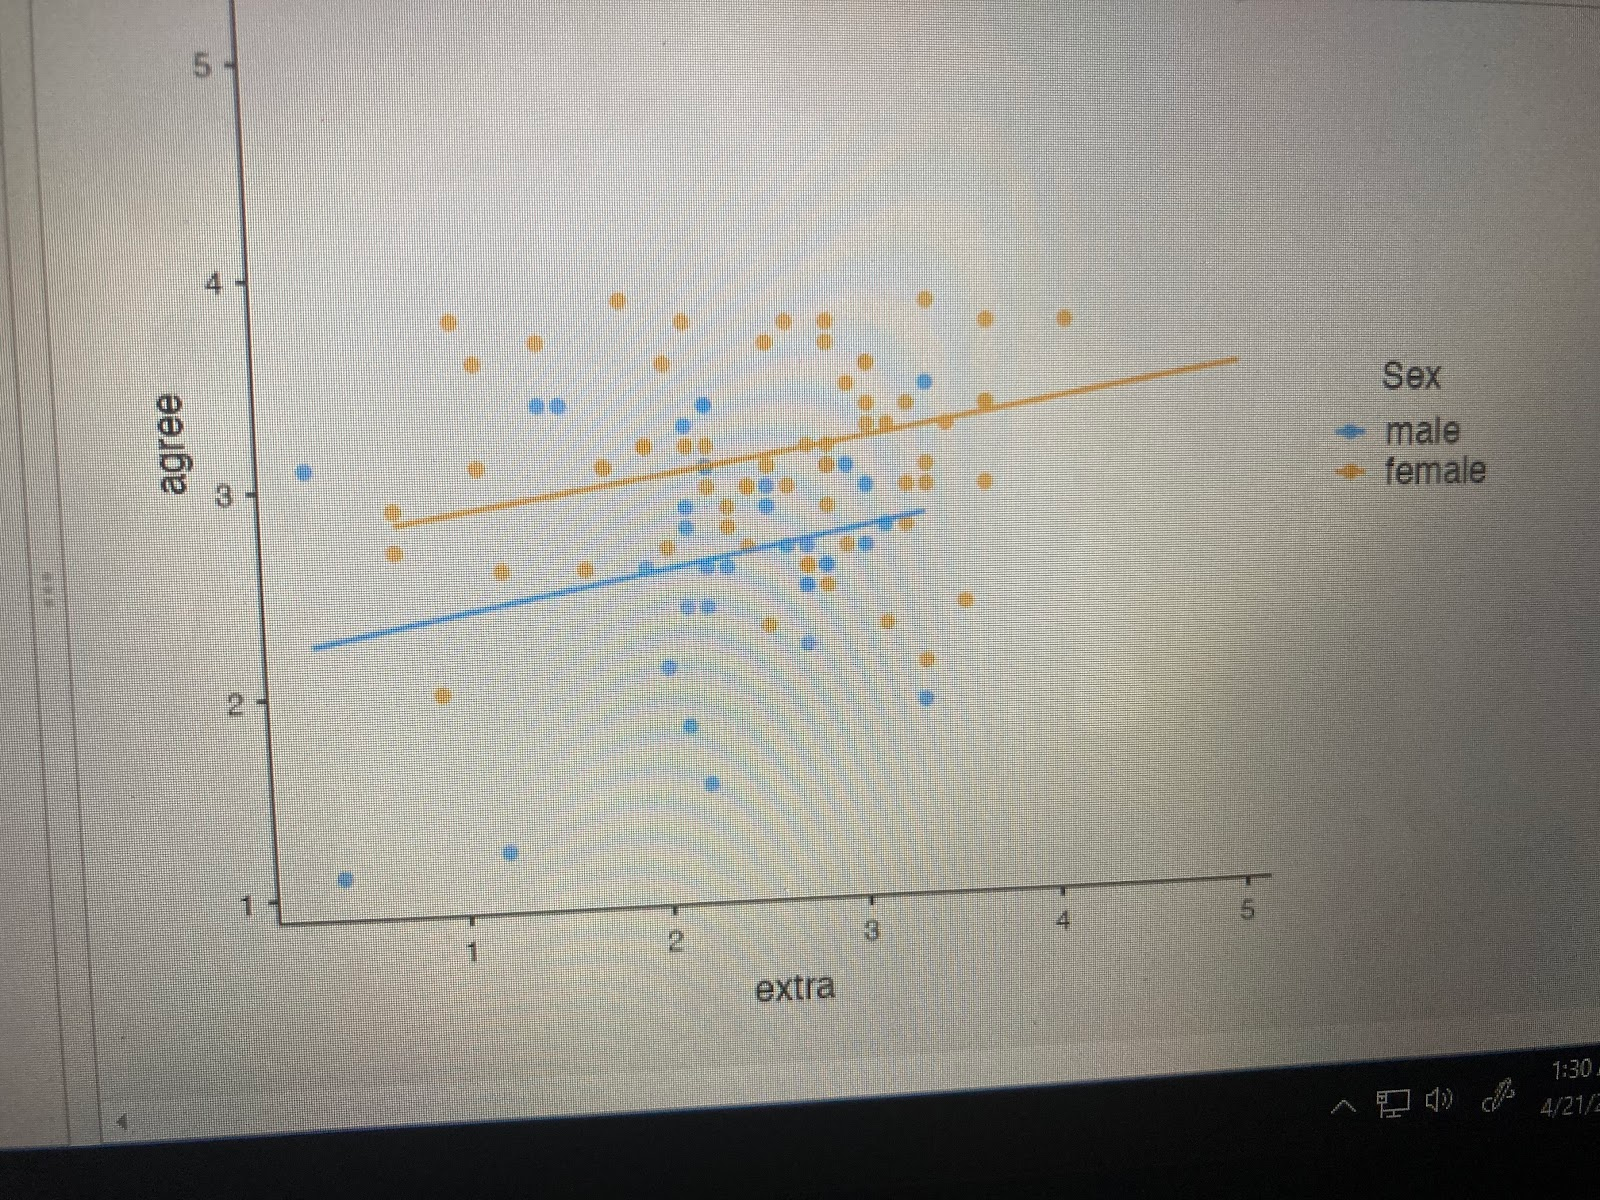
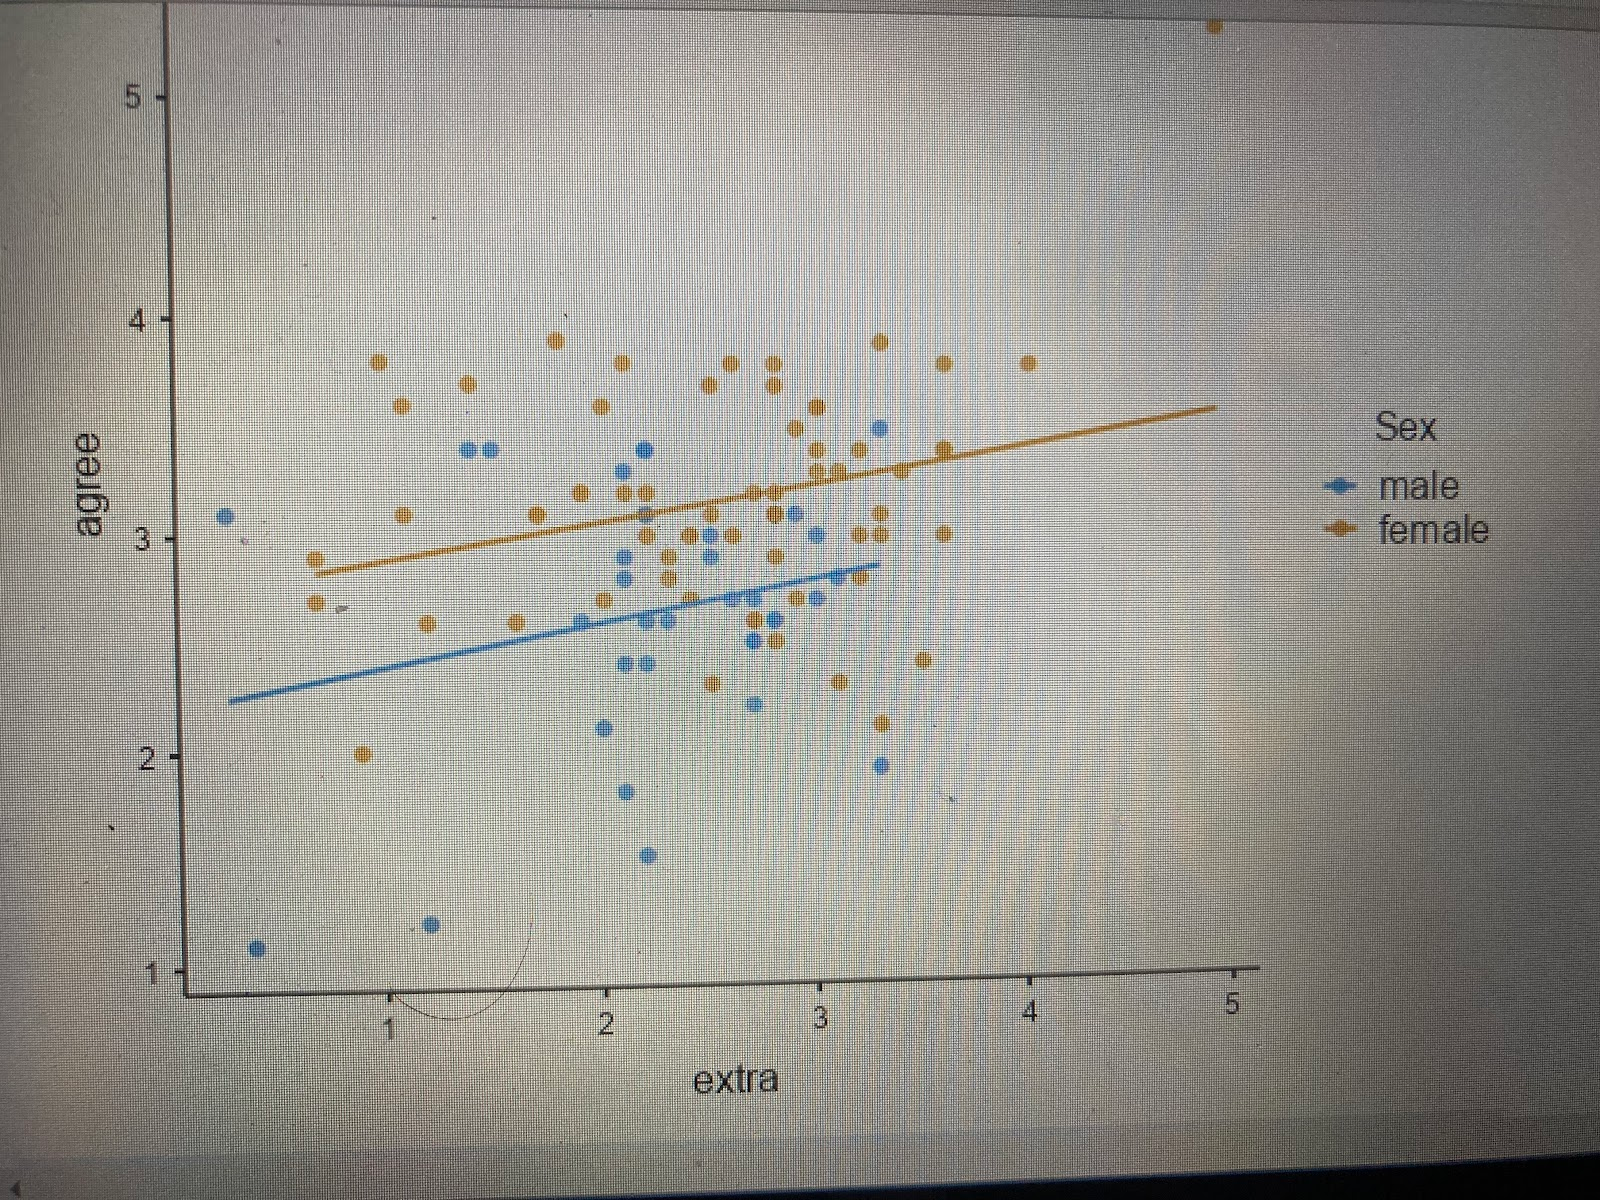
- The first should depict the relationship between extraversion and agreeableness.
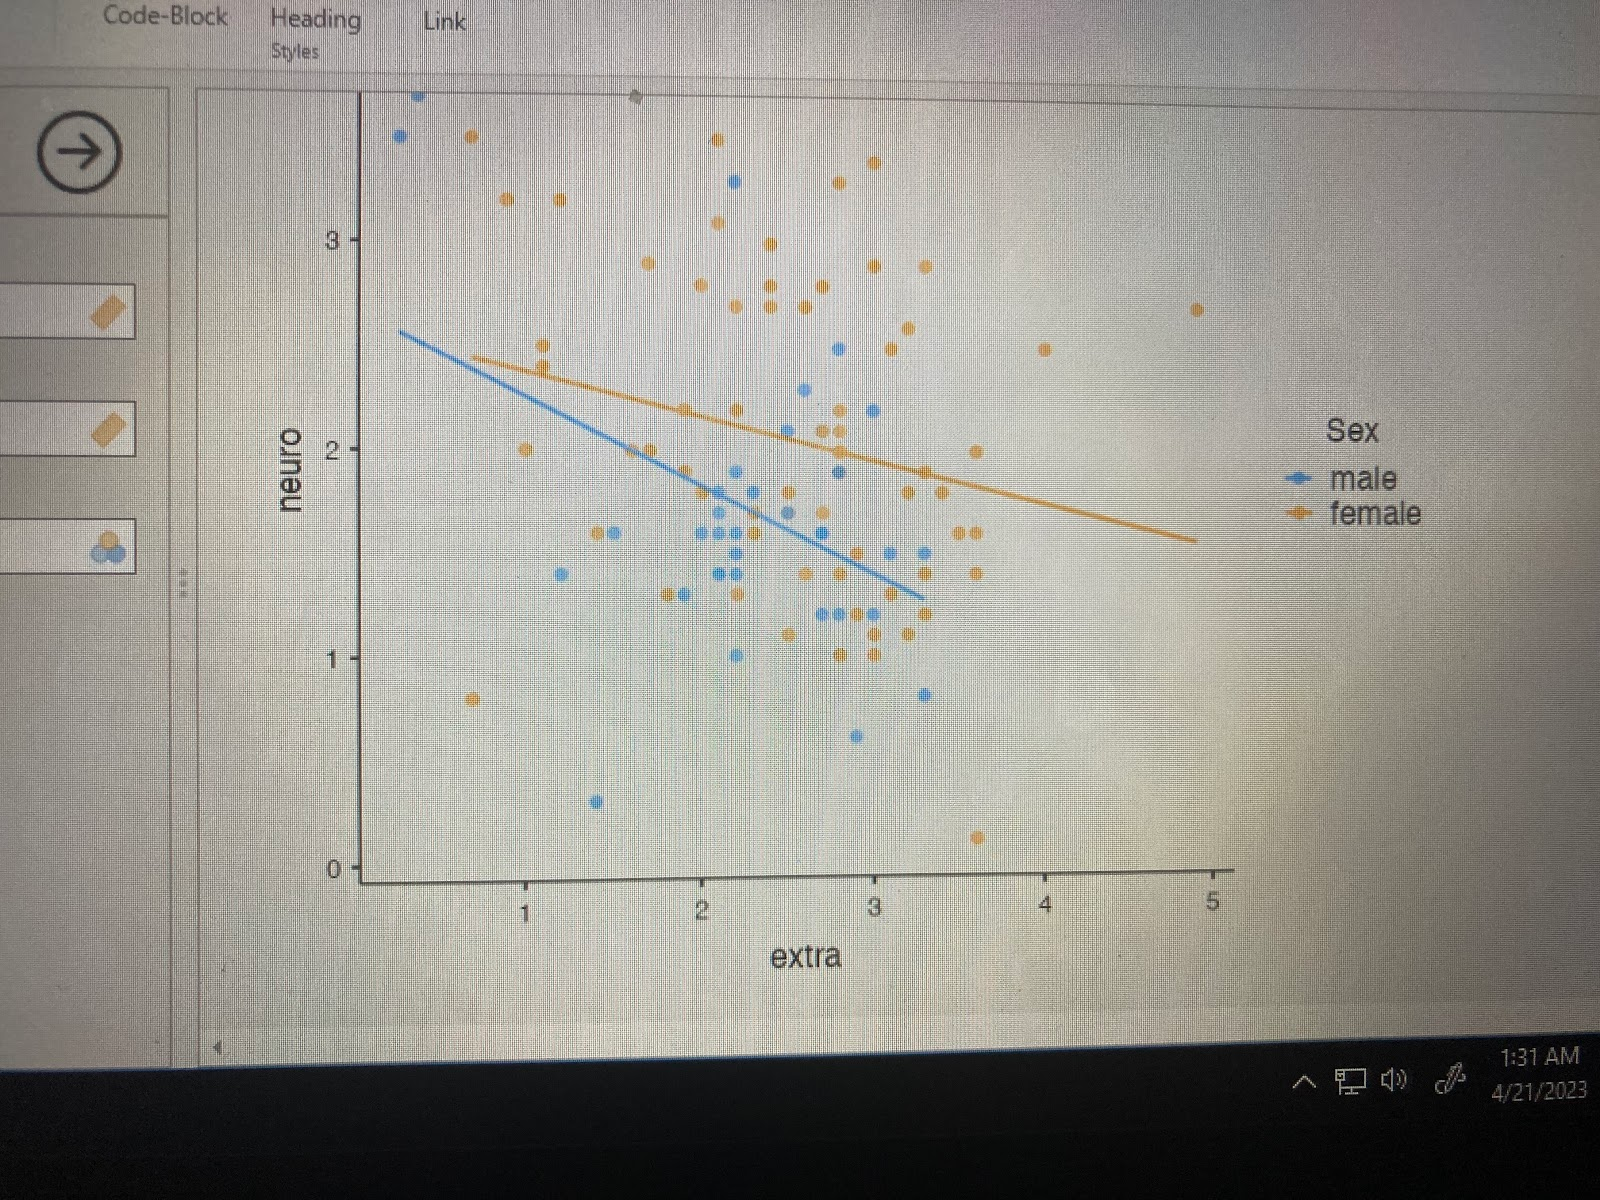
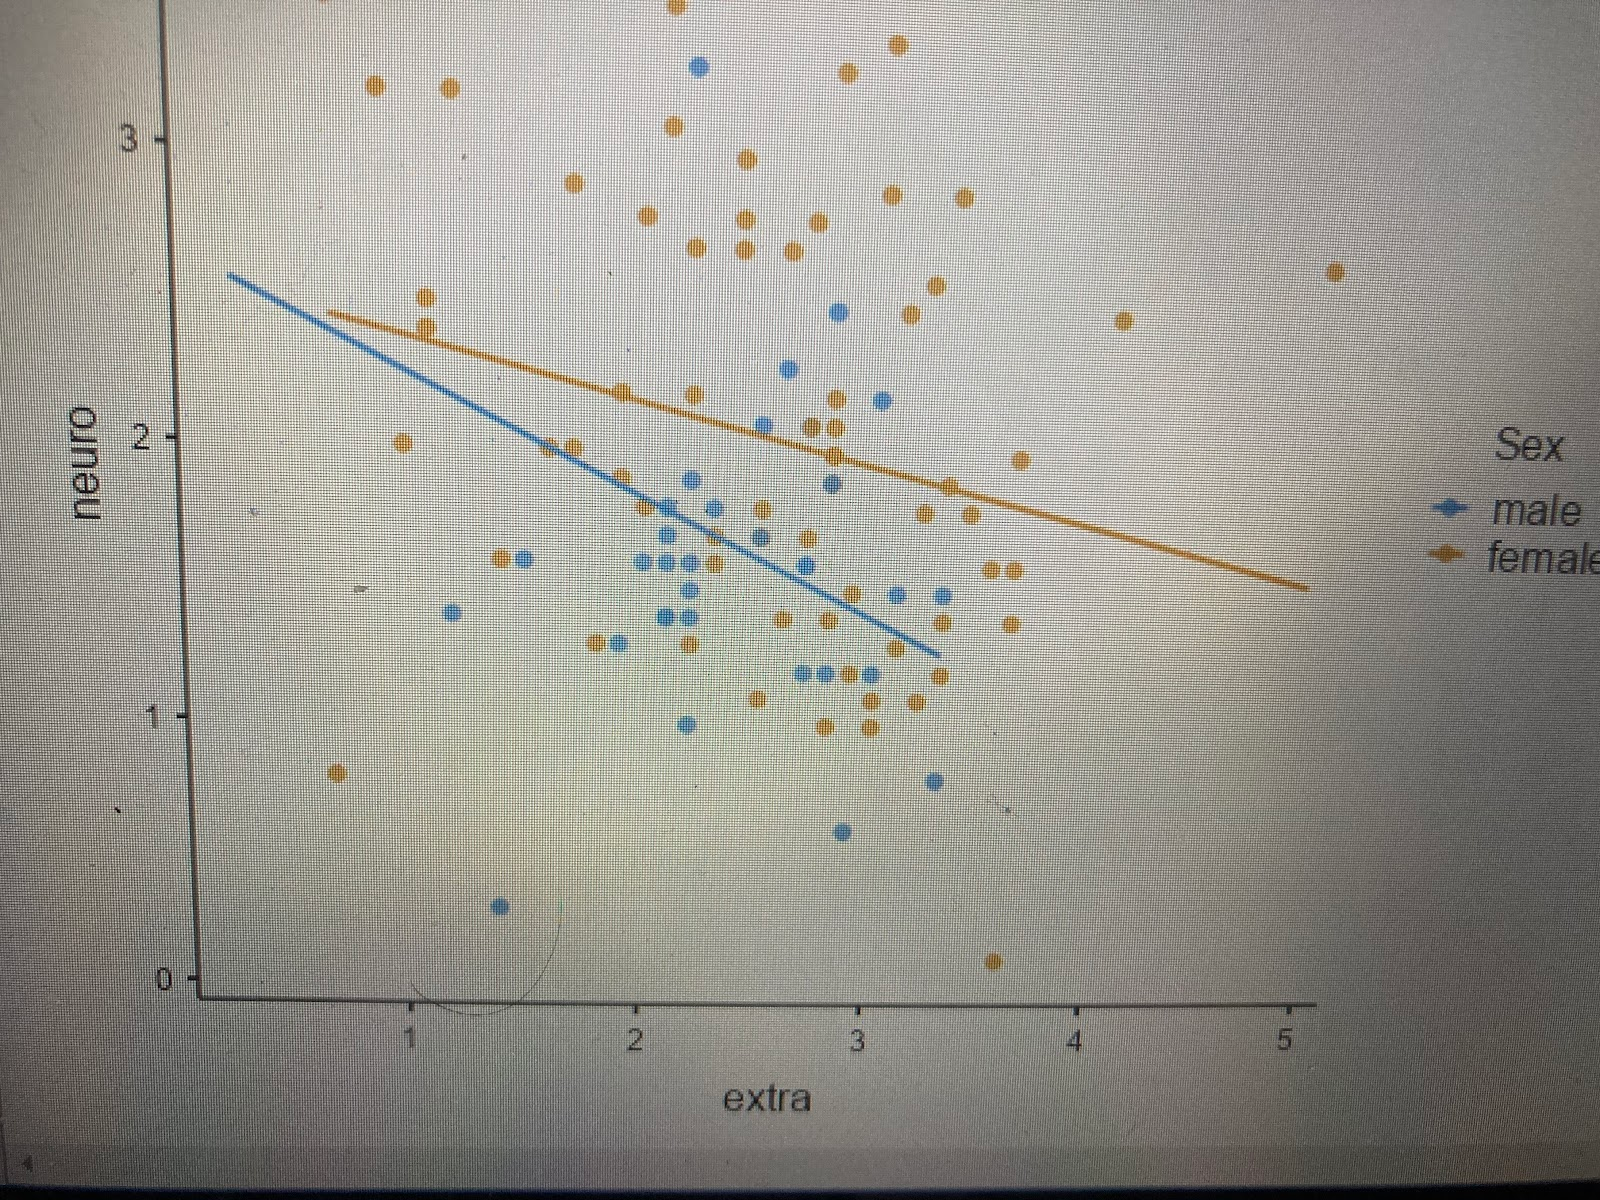
- The second is between extraversion and neuroticism.
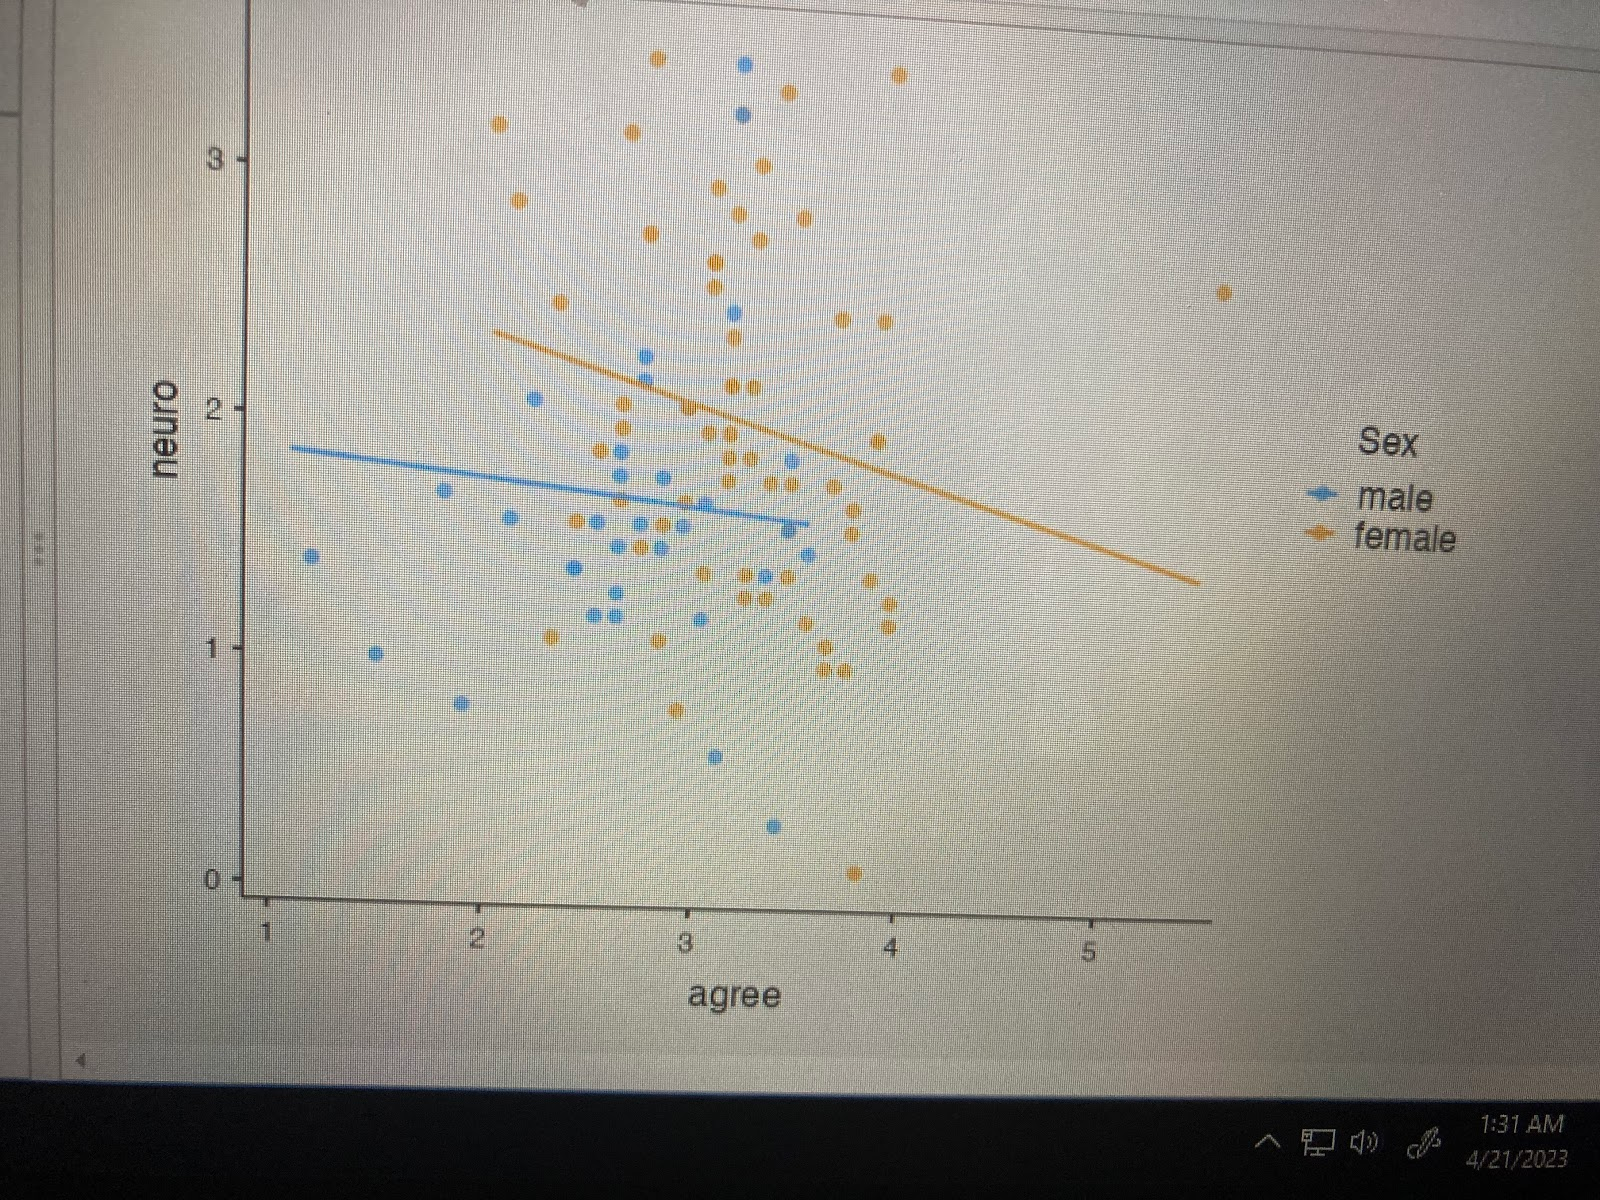
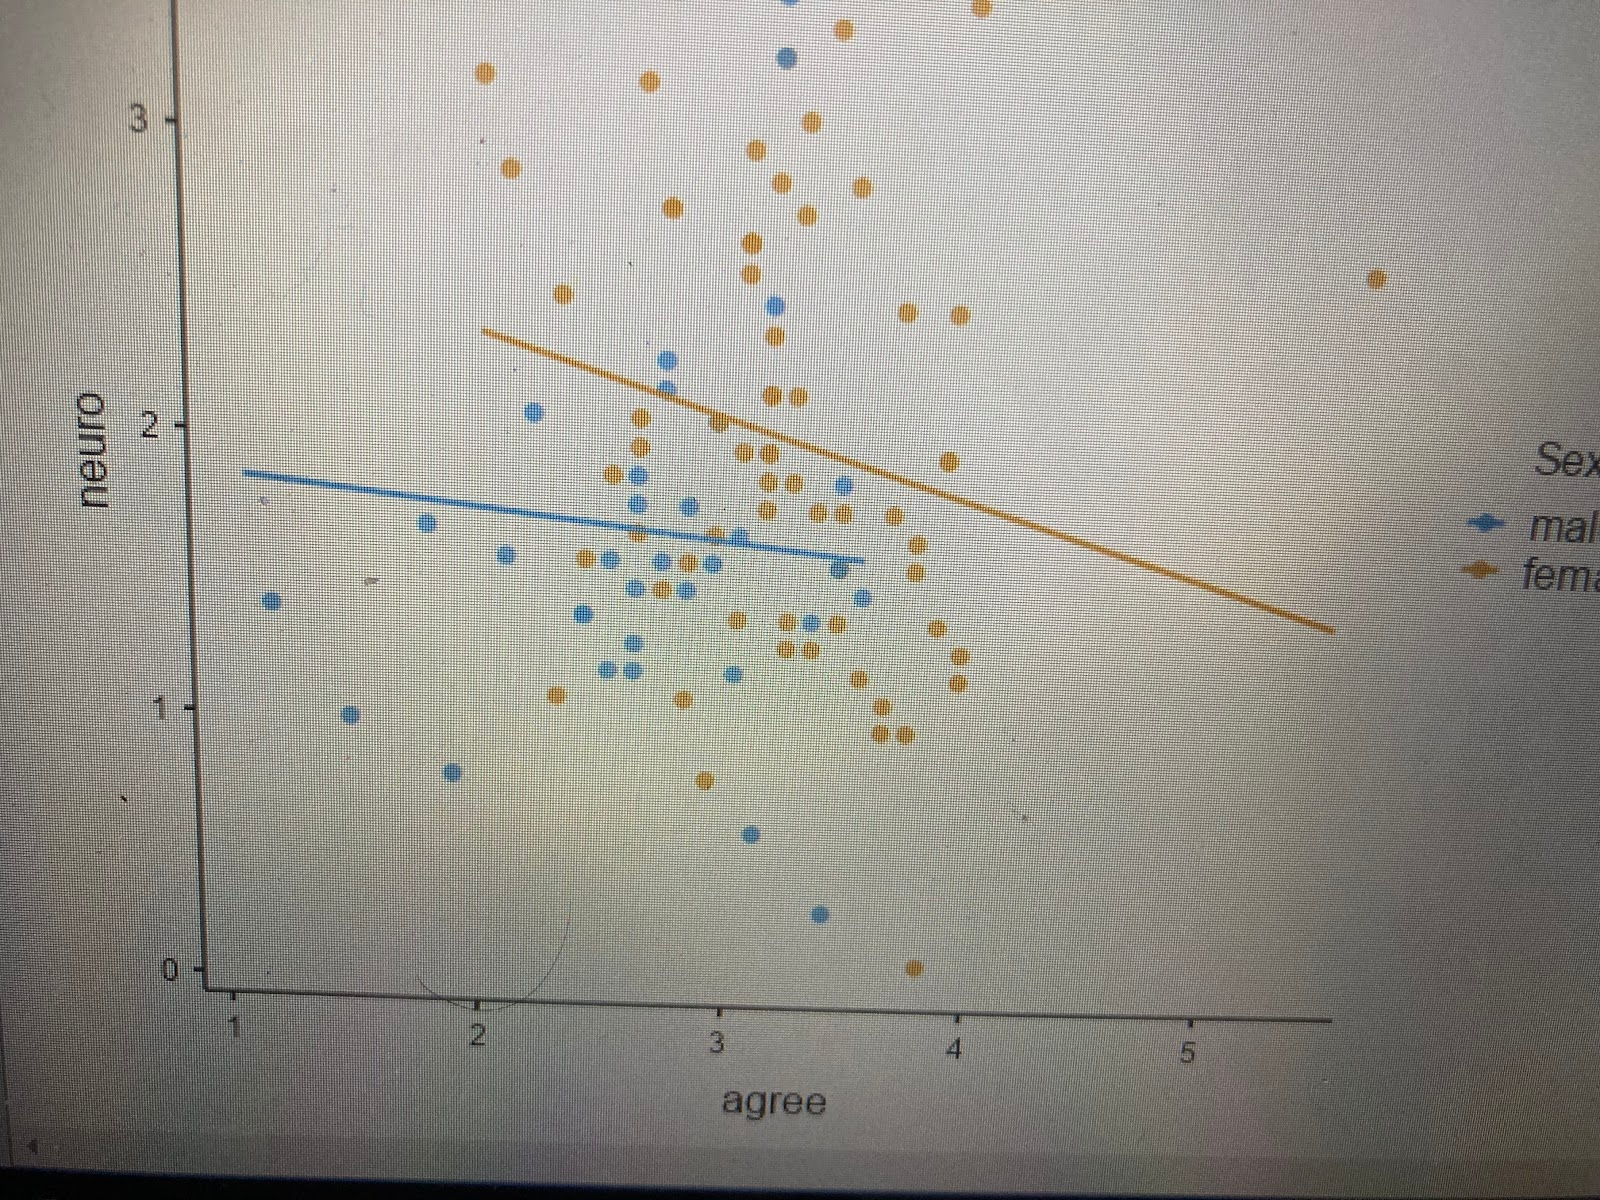
- The third is the relationship between agreeableness and neuroticism.
| Correlation Matrix | |||||||||
|---|---|---|---|---|---|---|---|---|---|
| extra | neuro | agree | |||||||
| extra | Pearson's r | ? | |||||||
| p-value | ? | ||||||||
| neuro | Pearson's r | -0.243 | * | ? | |||||
| p-value | 0.015 | ? | |||||||
| agree | Pearson's r | 0.299 | ** | -0.046 | ? | ||||
| p-value | 0.003 | 0.649 | ? | ||||||
| Note. * p | |||||||||
\fCode-Block Heading Link Styles 3 - Sex 2 neuro male female extra 1:31 AM 4/21/20232 Sex neuro male female 0 agree 1:31 AM 4/21/2023\f\f\f
Step by Step Solution
There are 3 Steps involved in it
1 Expert Approved Answer
Step: 1 Unlock

Question Has Been Solved by an Expert!
Get step-by-step solutions from verified subject matter experts
Step: 2 Unlock
Step: 3 Unlock