

Question: Part 1 - Check for Understanding - The graph shows P6 the United States domestic market for soybeans. The Domestic Supply letters on the graph
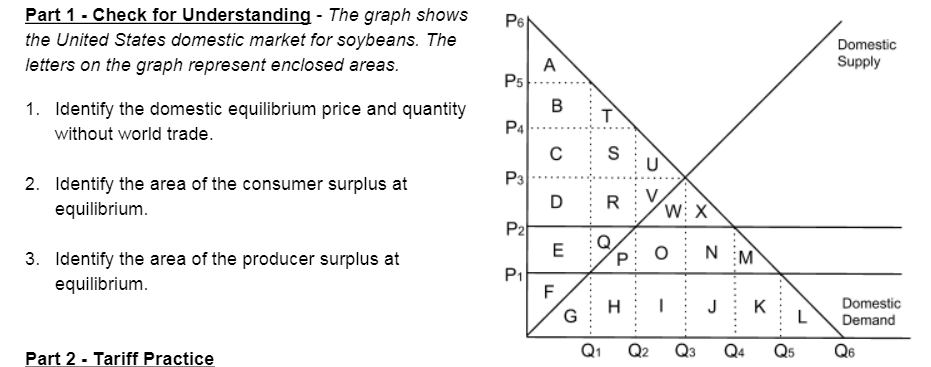

Part 1 - Check for Understanding - The graph shows P6 the United States domestic market for soybeans. The Domestic Supply letters on the graph represent enclosed areas. A P5 1. Identify the domestic equilibrium price and quantity B without world trade. C S U 2. Identify the area of the consumer surplus at D R equilibrium. W: X P2 E Q O N 3. Identify the area of the producer surplus at P :M P1 equilibrium. F H K Domestic G L Demand Q1 Q2 Q3 Q4 Q5 Q6 Part 2 - Tariff Practice
Step by Step Solution
There are 3 Steps involved in it
1 Expert Approved Answer
Step: 1 Unlock

Question Has Been Solved by an Expert!
Get step-by-step solutions from verified subject matter experts
Step: 2 Unlock
Step: 3 Unlock