

Question: Part 1. Clustering: (1) Read the data from icecream3.csv (2) Run kmean=1. What is the total within cluster sum of squares? (3) Run kmeans 3(km3)
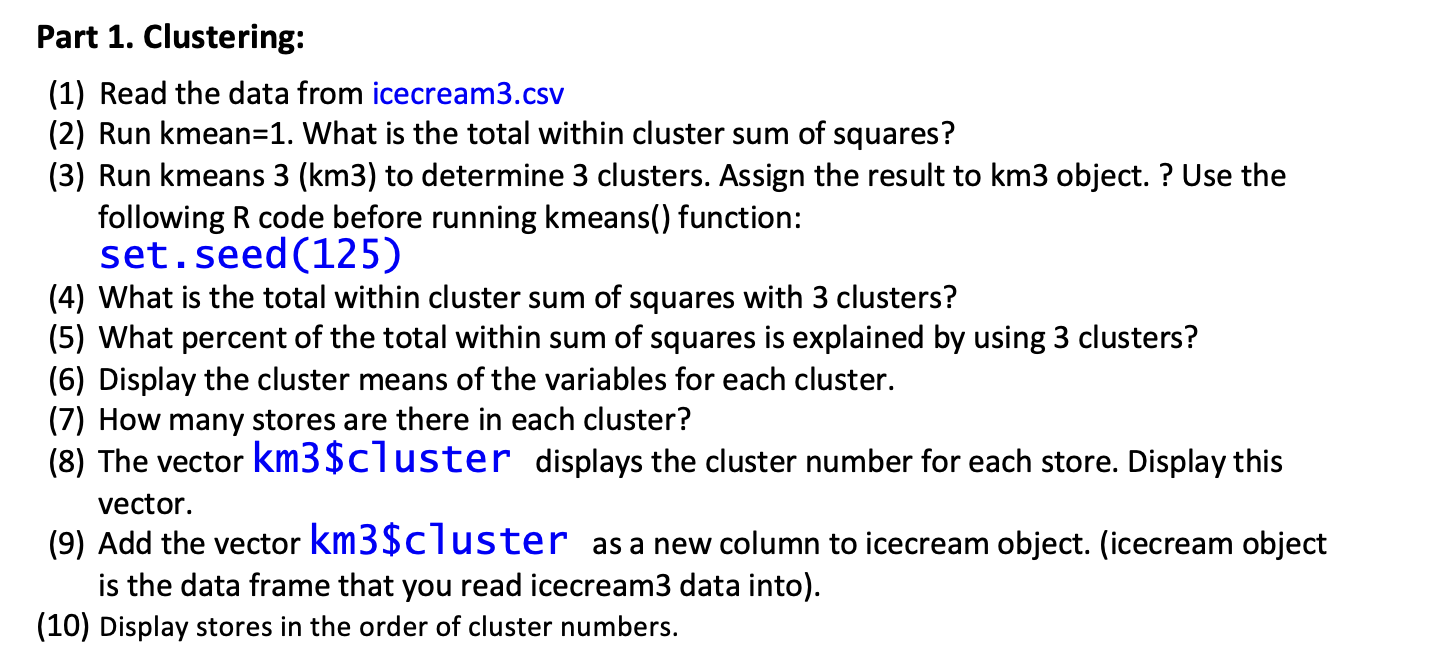
Part 1. Clustering: (1) Read the data from icecream3.csv (2) Run kmean=1. What is the total within cluster sum of squares? (3) Run kmeans 3(km3) to determine 3 clusters. Assign the result to km3 object. ? Use the following R code before running kmeans() function: set. seed (125) (4) What is the total within cluster sum of squares with 3 clusters? (5) What percent of the total within sum of squares is explained by using 3 clusters? (6) Display the cluster means of the variables for each cluster. (7) How many stores are there in each cluster? (8) The vector km3$C7 uster displays the cluster number for each store. Display this vector. (9) Add the vector km3$c7 uster as a new column to icecream object. (icecream object is the data frame that you read icecream3 data into). (10) Display stores in the order of cluster numbers
Step by Step Solution
There are 3 Steps involved in it

Get step-by-step solutions from verified subject matter experts