

Question: Part 1 : Consider the following ( rather poor ) model for a two species interaction ( Rabbits and Foxes ) : In this model
Part :
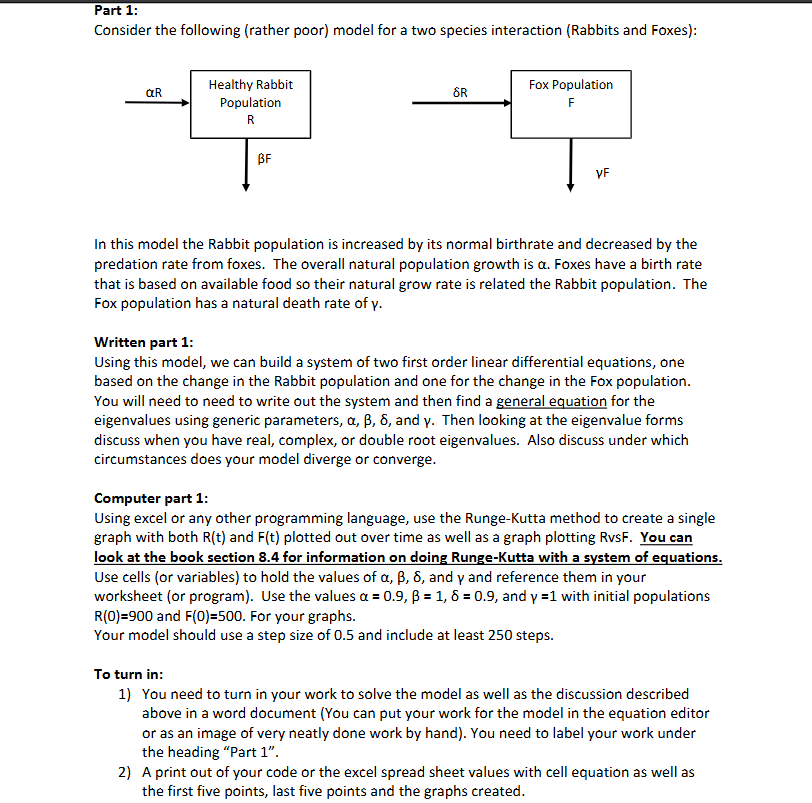
Consider the following rather poor model for a two species interaction Rabbits and Foxes:
In this model the Rabbit population is increased by its normal birthrate and decreased by the predation rate from foxes. The overall natural population growth is alpha Foxes have a birth rate that is based on available food so their natural grow rate is related the Rabbit population. The Fox population has a natural death rate of gamma
Written part :
Using this model, we can build a system of two first order linear differential equations, one based on the change in the Rabbit population and one for the change in the Fox population. You will need to need to write out the system and then find a general equation for the eigenvalues using generic parameters, alphabetadelta and gamma Then looking at the eigenvalue forms discuss when you have real, complex, or double root eigenvalues. Also discuss under which circumstances does your model diverge or converge.
Computer part :
Using MATLAB use the RungeKutta method to create a single graph with both Rt and Ft plotted out over time as well as a graph plotting RvsF You can look at the book section for information on doing RungeKutta with a system of equations.
Use cells or variables to hold the values of alphabetadelta and gamma and reference them in your worksheet or program Use the values alphabetadelta and gamma with initial populations R and F For your graphs.
Your model should use a step size of and include at least steps.
To turn in:
You need to turn in your work to solve the model as well as the discussion described above in a word document You can put your work for the model in the equation editor or as an image of very neatly done work by hand You need to label your work under the heading "Part
A print out of your code or the excel spread sheet values with cell equation as well as the first five points, last five points and the graphs created.
Step by Step Solution
There are 3 Steps involved in it
1 Expert Approved Answer
Step: 1 Unlock

Question Has Been Solved by an Expert!
Get step-by-step solutions from verified subject matter experts
Step: 2 Unlock
Step: 3 Unlock