

Question: Part 1 - Draw a flowchart that gets temperature and wind speed from user, then calculates and displays the wind - chill index. a .
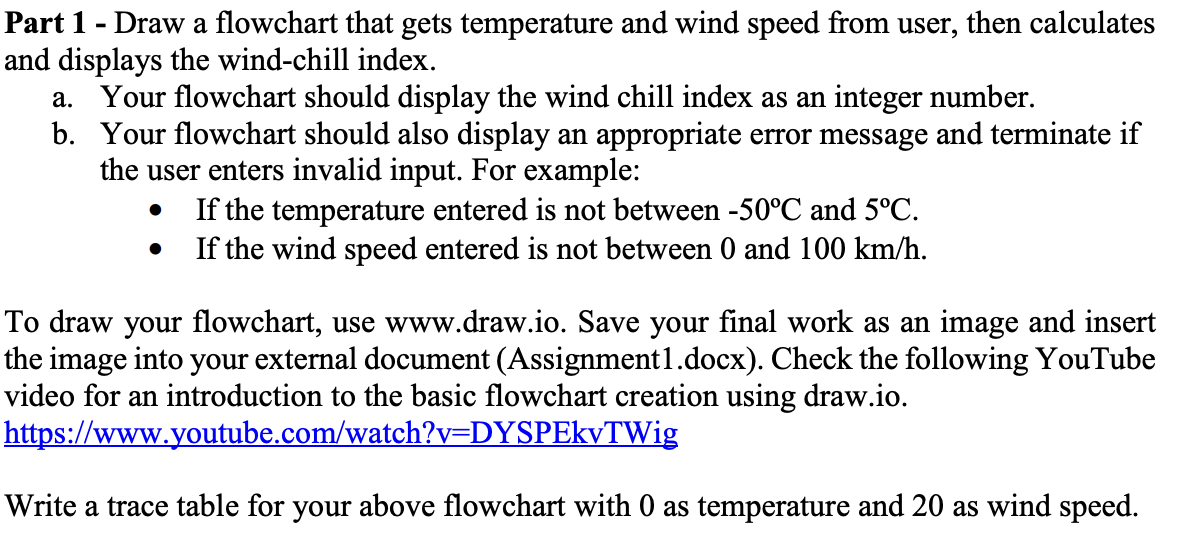
Part Draw a flowchart that gets temperature and wind speed from user, then calculates
and displays the windchill index.
a Your flowchart should display the wind chill index as an integer number.
b Your flowchart should also display an appropriate error message and terminate if
the user enters invalid input. For example:
If the temperature entered is not between and
If the wind speed entered is not between and
To draw your flowchart, use
wwwdraw.io Save your final work as an image and insert
the image into your external document Assignmentdocx Check the following YouTube
video for an introduction to the basic flowchart creation using
draw.io
https:wwwyoutube.comwatchvDYSPEkvTWig
Write a trace table for your above flowchart with as temperature and as wind speed. Write this in Java.
Step by Step Solution
There are 3 Steps involved in it
1 Expert Approved Answer
Step: 1 Unlock

Question Has Been Solved by an Expert!
Get step-by-step solutions from verified subject matter experts
Step: 2 Unlock
Step: 3 Unlock