

Question: Part 1 Formatting the data sets and calculating the High - low method using number of trips Download the Excel file ( included as attached
Part
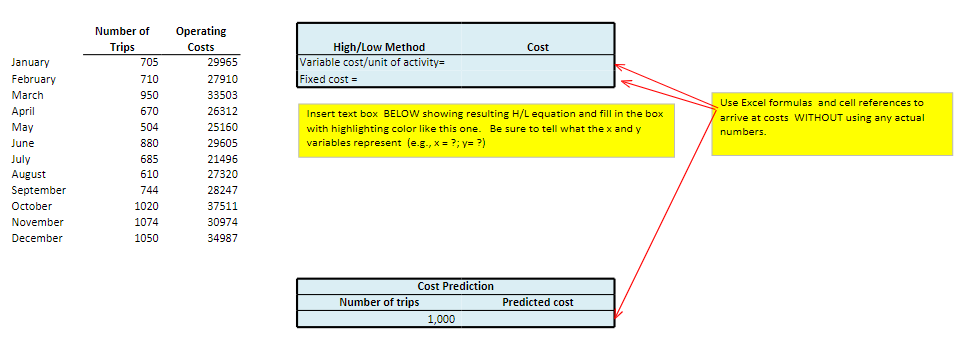
Formatting the data sets and calculating the Highlow method using number of trips
Download the Excel file included as attached image that contains the data sets.
Use the formatting options on the toolbar format number tab to add dollar signs to the cost column and commas to the volume column. Delete any extra decimal places not needed.
On the Number of Trips datasheet, use the highlow method to determine the cost equation that expresses how monthly operating costs behave in relation to the number of trips made. First, highlight the two months you will using the highlight icon looks like a spilling paint bucket Follow the directions on the screen to calculate the variable and fixed portions of the equation in the space provided. Then use insert textbox to state the resulting highlow equation and define the x and y variables in the equation x ; y
Use the resulting cost equation to predict total operating costs for a month in which trips are made. Use the space provided.
Part
Scatter plot, regression line, and highlow line using the number of trips
Highlight all of the volume and cost data with the cursor.
Click on the insert tab on the menu bar and then choose Scatter as the chart type. Next, click the plain scatter plot without any lines Youll now see the scatter plot on the page. Click on Move chart location on the toolbar to move the chart to a new sheet so that its nice and big
Click on Quick Layout on the toolbar and choose Layout Add a descriptive title for the scatter plot and appropriate labels for each axis by clicking on the Chart Title and Axis Titles and typing in your own titles. Delete the Series legend by rightclicking on it and then deleting it
To add the regression line, place your pointer on any data point on the graph and rightclick the mouse. Choose Add Trendline and choose Linearthe default To add the regression equation and R value, also choose Display the equation on the chart and Display the Rsquared value on the chart. Drag and drop the equation and rsquare to a suitable location on the graph.
The regression line you see does not automatically stretch back to the yaxis. To make it intersect the yaxis, put your pointer on the line, and rightclick the mouse. Choose Format trendline, then look at the forecast backward box. This feature allows you to extend the line back to the yaxis by forecasting back from your lowest xvalue. To do this, insert the lowest x value in the forecast backward box. Youll find the lowest x value by hovering your cursor over the lowestvolume data point and looking at the x value associated with it Label the line using the Insert Textbox command.
To draw in the highlow line, choose insert then shapes then click on the straight line from the list of possible shapes. Put your cursor on the highestvolume data point and drag the line through the lowestvolume data point, all the way back to the yaxis. Now check: does the fixed cost in your highlow equation agree with the line you just drew? It should. Label the line.
Use inserttextbox to comment on which line looks like it better represents the data points. Explain why the two lines are different.
Use inserttextbox to address the following:
Predict Shimas operating costs for a month in which trips are made. This time, use the regression equation. Compare the result to the prediction you made using the highlow method.
Interpret the R square figure.
In general, what does the Rsquare statistic tell management?
What is the Rsquare value from this regression? What does it tell you about this particular set of data and your confidence in using the resulting equation for making predictions?
Rename the sheet by rightclicking on the Chart tab at the bottom of the screen and choosing rename Give the sheet an appropriate name.
Step by Step Solution
There are 3 Steps involved in it
1 Expert Approved Answer
Step: 1 Unlock

Question Has Been Solved by an Expert!
Get step-by-step solutions from verified subject matter experts
Step: 2 Unlock
Step: 3 Unlock