

Question: PART 1: Getting Started with JASP You will need to have access to JASP to complete assignment and all remaining assignments in this course. For
PART 1: Getting Started with JASP
You will need to have access to JASP to complete assignment and all remaining assignments in this course. For installation information, troubleshooting guides, and support, please refer to the JASP Statistical Software page on Campus.
For this part of the assignment you will use the GSS_30s.csv file, which can be found on the Week 2 Assignment page in Canvas. These data were extracted from the General Social Survey (GSS). In this file, data were limited to individuals between the ages of 30 and 39 who completed the survey in 2022. While it is not necessary for this assignment, if you are interested, you can learn more about the GSS here.
The dataset includes the following variables:
year: Year in which that participant's data were collected
id_: A unique nominal-level identification number assigned to each participant
childs: Number of children the participant has
age: Age in years
sex: Sex assigned at birth; options were limited to "Male" and "Female"
race: Race; options were limited to "Black," "White," and "Other"
income: Annual income range
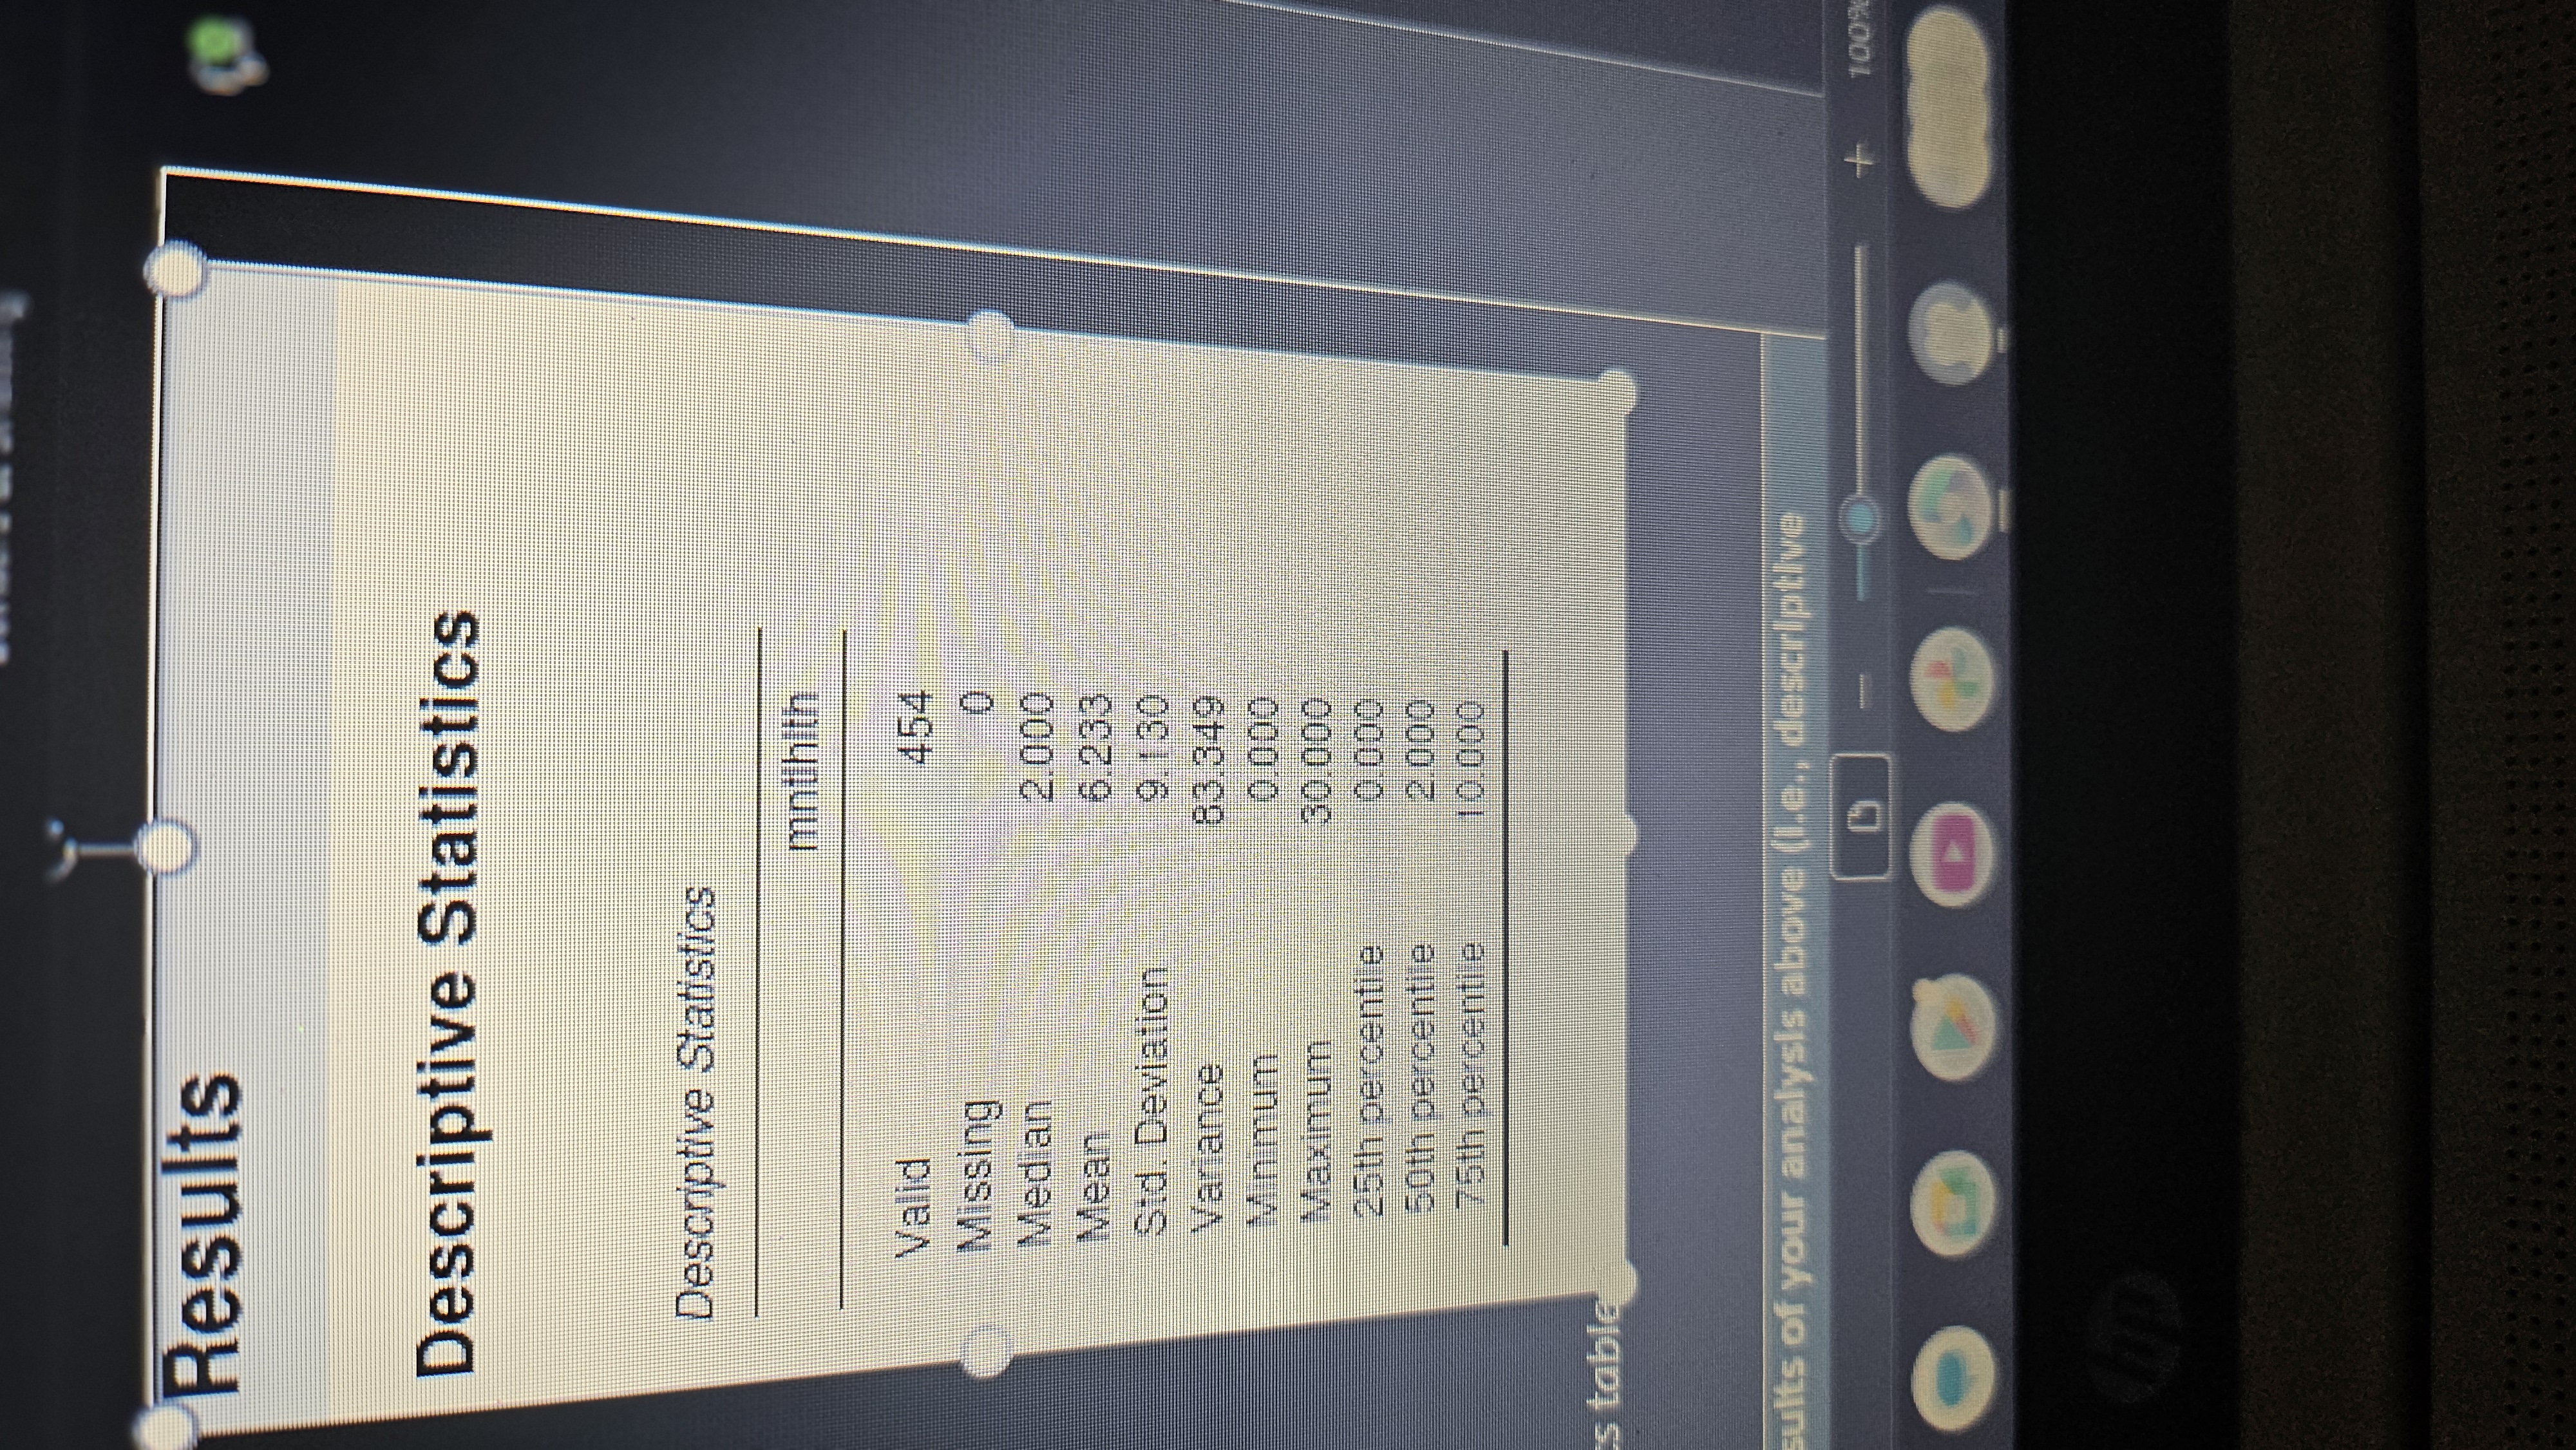
mntlhlth: Number of days with poor mental health in the last 30 days
depress: Whether the participant has ever been told by a medical professional that they have depression; options were limited to "Yes" and "No"
I only need help with this question about Write sentence or two summarizing the results of your analysis above (i.e., descriptive statistics for the mntlhlth variable). Your summary should be consistent with APA style (e.g., appropriate use of abbreviations) and include the following elements: sample size, mean, and standard deviation.
Step by Step Solution
There are 3 Steps involved in it

Get step-by-step solutions from verified subject matter experts