

Question: Part 1: Hypothetical Tax Code 1 Consider a simplified version of the real tax code. Assume that the tax rate on all taxable income is
Part 1: Hypothetical Tax Code 1
Consider a simplified version of the real tax code. Assume that the tax rate on all taxable income is 15% and the standard deduction ($6,350) and personal exemption ($4,050) still apply. I only need question 5 answered in this section.
- If your total income before exemptions was $35,000, what is your taxable income?
- How much would you have to pay in taxes on this income?
- What percentage of your total income would you pay in taxes?
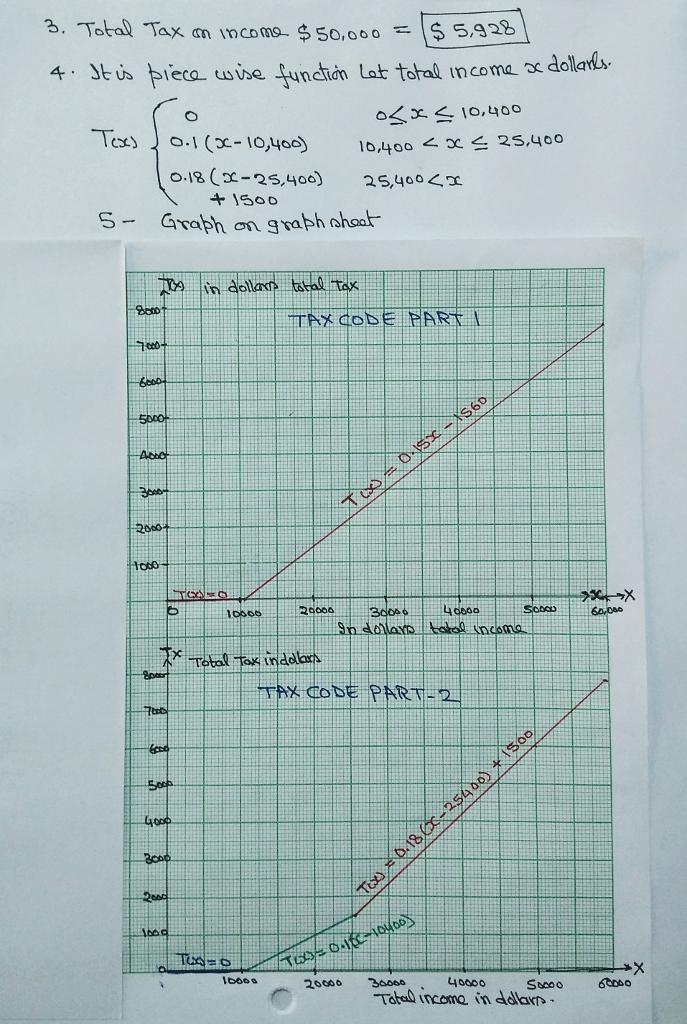
- Write a function to model the total tax paid, T(x), with a total income of x dollars.
- How many different slopes are on this graph (below)? What do they represent?
Below is a graph that shows taxes paid as a function of total income for the total income between $0 and $60,000
Part 2: Hypothetical Tax Code 2:
Now consider another hypothetical tax code. Assume the tax rate on the first $15,000 of taxable income is 10% and the tax rate on any additional income is 18%. The standard deduction ($6,350) and personal exemption ($4,050) still apply. I only need question number 6 answered in this section. The graph is already provided for number 5.
In other words:
• For taxable income from $0 to $15,000, you pay 10% of your taxable income in taxes, plus
• For taxable income above $15,000, you pay 18% of your taxable income.
1. If your total income before exemptions were $10,000 how much would you pay in taxes?
2. If your total income were $20,000 how much would you pay in taxes?
3. If your total income were $50,000 how much would you pay in taxes?
4. Write a function to model the total tax paid, T(x), with a total income of x dollars.
5. Create a graph that shows taxes paid as a function of total income for the total income between $0 and $60,000
6.. How many different slopes are on this graph?
NOTE: For a Total Income of $80,000, and individual would pay $11,328 in taxes.
Part 3: House Tax Plan for 2018
For 2017 the actual tax brackets for a single tax filer were:
• For taxable income from $0 to $9,325, you pay 10% of it in taxes, plus
• For taxable income from $9,326 to $37,950, you pay 15% of it in taxes, plus
• For taxable income from $37,951 to $91,900, you pay 25% of it in taxes, plus
• For taxable income from $91,901 to $191,650, you pay 28% of it in taxes, plus
• For taxable income from $191,651 to $416,700, you pay 33% of it in taxes, plus
• For taxable income from $416,701 to $418,400, you pay 35% of it in taxes, plus
• For taxable income at or above $418,401, you pay 39.6%.
At the end of 2017, the House proposed a new tax plan: (http://www.businessinsider.com/tax-brackets-2018-trump-tax-plan-chart-house-senate-comparison-2017-11)
Proposed New Tax Plan:
• For taxable income from $0 to $45,000, you pay 12% of it in taxes, plus
• For taxable income from $45,001 to $200,000, you pay 25% of it in taxes, plus
• For taxable income from $200,001 to $500,000, you pay 35% of it in taxes, plus
• For taxable income of $500,001 or more, you pay 39.6%.
Where the standard deduction was raised to $12,200 and the personal exemption was eliminated. For the remaining exercises, we will only consider this proposed tax plan.
Complete both tables below
Taxable Income
| Lower Bounch | Upper Bound | Rate | Maximum Money in Bracket | Maximum Tax in Bracket |
| $0 | $45,000 | 12% | $5,400 | |
| $45,000 | $200,000 | 25% | $155,000 | $44,150 |
| $200,000 | $500,000 | 35% | $105,000 | |
| $500,000 | No Limit | No Limit | No Limit |
Total Income
| Lower Bound | Upper Bound | Rate | Maximum Money in Bracket | Maximum Tax in Bracket |
| 0$ | $12,200 | 0% | $12,200 | 0$ |
| $57,200 | $45,000 | |||
| $38,750 | ||||
| $512,200 | No Limit | No Limit | No Limit |
- How many slopes would be on this graph?
- Write a function to model the total tax paid, T(x), with a total income of x dollars.
- How much does a person pay in taxes if their total income is $210,000?
- What is the slope of the line when an individual's total income is $210,000?
NOTE: For a Total Income of $85,000, an individual would pay $12,350 in taxes
3. Total Tax on income $50,000 = $ 5,928 4. It is piece wise function Let total income x dollares. Texs 8000 +1500 5- Graph on graph sheet -7.000- -6000- 5000 Abso 2000- 1000 2000 7000 0.1 (x-10,400) 0.18 (x-25,400) 6 Ecce 5000 Xx Total Tax in dollars 4000 2000 4210 3000 1000 in dollars total Tax 10000 Twxx=0 10000 0
Step by Step Solution
3.43 Rating (156 Votes )
There are 3 Steps involved in it
PART 1 HYPOTHE TICAL TAX CODE 1 1 Taxable income 3500063504050 24600 2 Ta... View full answer

Get step-by-step solutions from verified subject matter experts