

Question: Part 1: Make a chart and estimate a linear trendline model for yield, you will need the equation, and the R 2 . Make ANOTHER
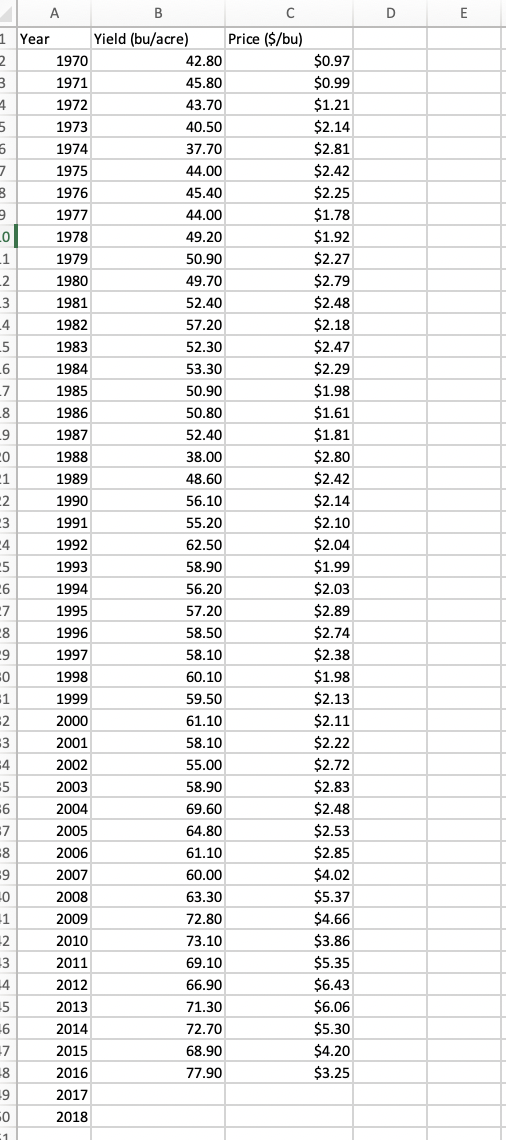
Part 1: Make a chart and estimate a linear trendline model for yield, you will need the equation, and the R2.
Make ANOTHER chart FOR Barley PRICE that includes a linear trendline, you will need the equations and R2. Are barley prices trending up or down?
In the part 1 worksheet set up and estimate a AR(1) model for barley prices using the solver method, also check your results using the Excel regression tool, and you will need the R2.
What are the two price forecasting models suggesting about barley prices? Do the models indicate the same trend in price?
In the 'Part 1 Table' worksheet complete the table summarizing the forecasts for the next three years and the R2 values for each of the estimated models. In the text box discuss your findings.
Step by Step Solution
There are 3 Steps involved in it

Get step-by-step solutions from verified subject matter experts