

Question: Part 1: Multiple Choice & Short Answer 1. An analyst has gathered the following information about Barnstabur, Inc., for the year: Reported net income of
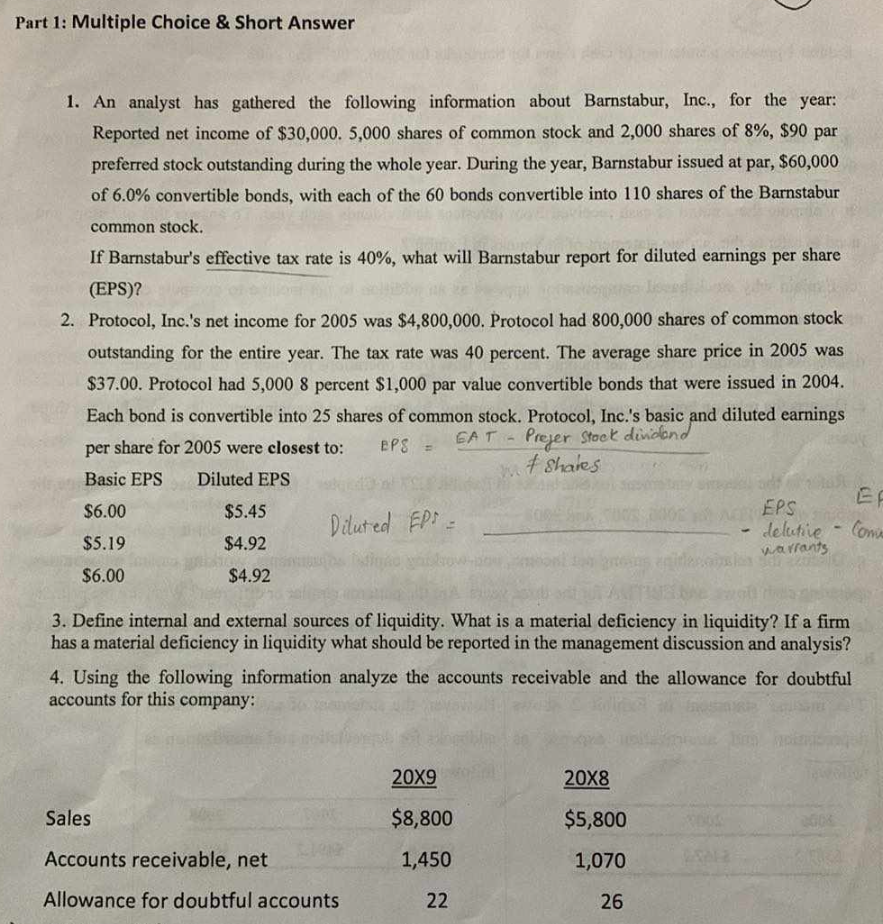
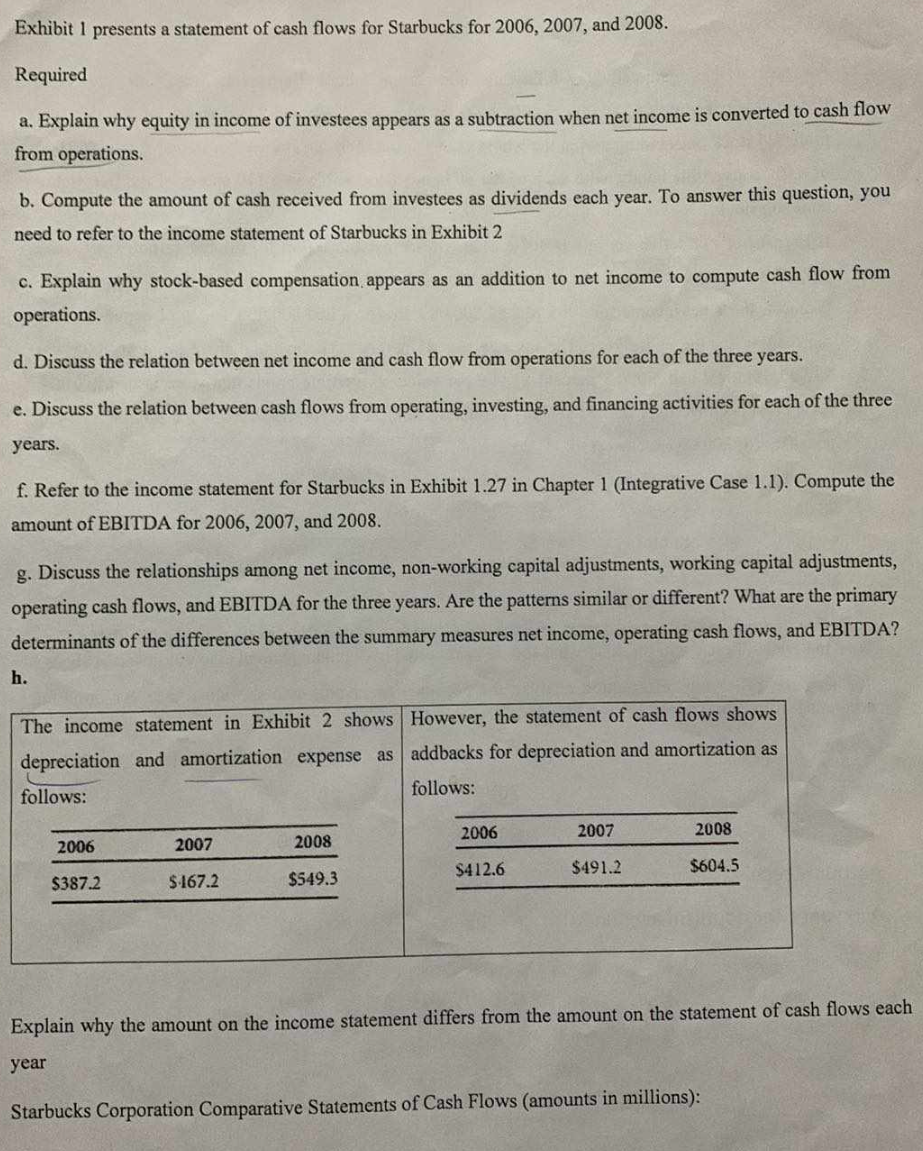
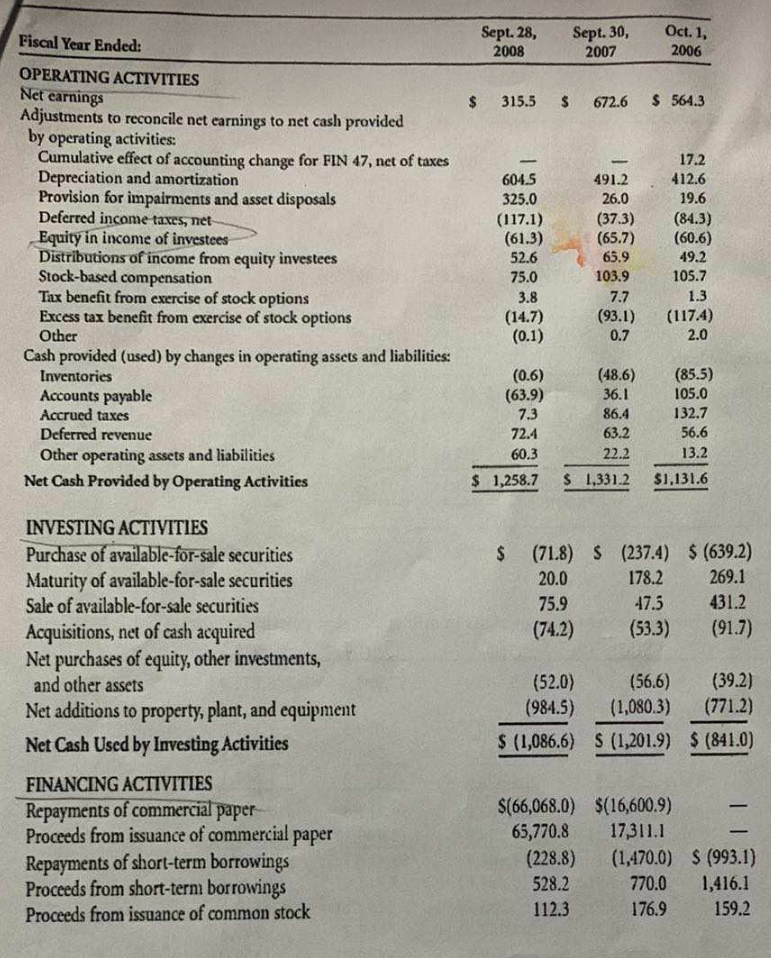
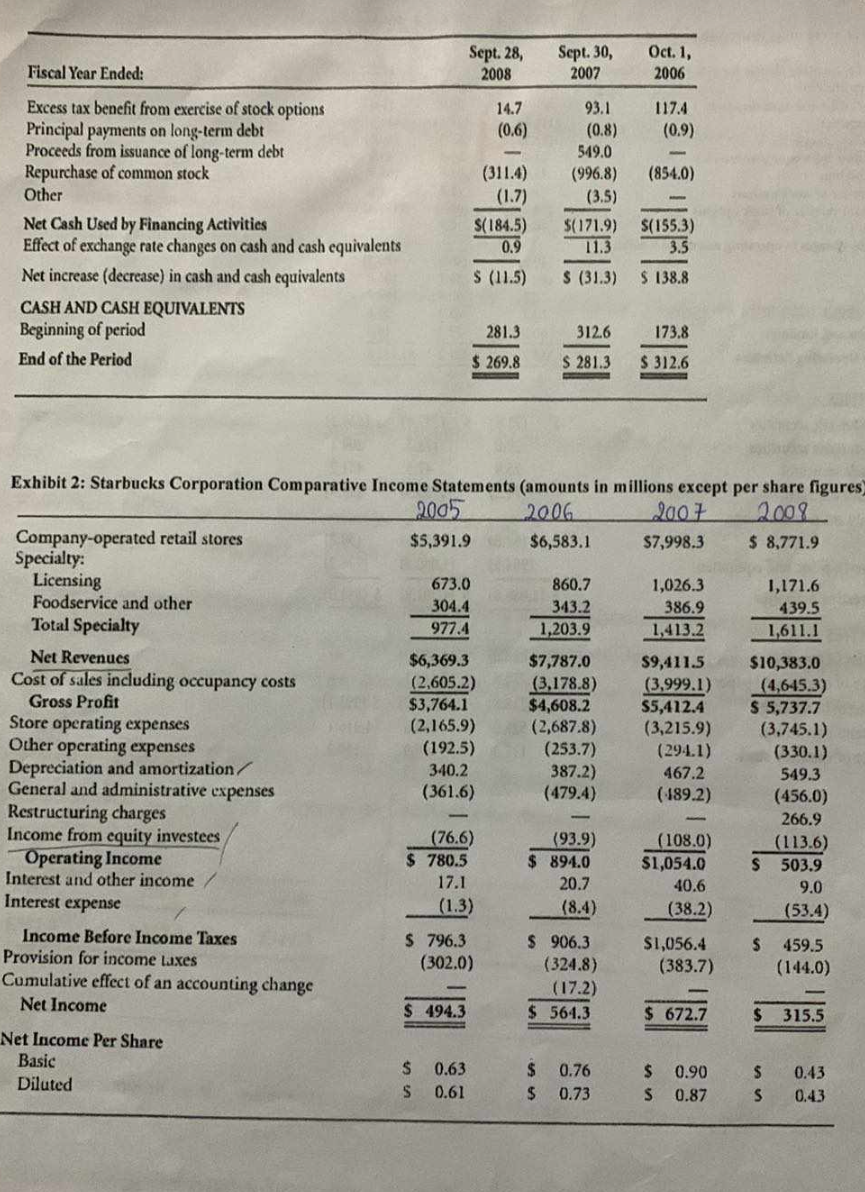
Part 1: Multiple Choice & Short Answer 1. An analyst has gathered the following information about Barnstabur, Inc., for the year: Reported net income of $30,000. 5,000 shares of common stock and 2,000 shares of 8%, $90 par preferred stock outstanding during the whole year. During the year, Barnstabur issued at par, $60,000 of 6.0% convertible bonds, with each of the 60 bonds convertible into 110 shares of the Barnstabur common stock. If Barnstabur's effective tax rate is 40%, what will Barnstabur report for diluted earnings per share (EPS)? 2. Protocol, Inc.'s net income for 2005 was $4,800,000. Protocol had 800,000 shares of common stock outstanding for the entire year. The tax rate was 40 percent. The average share price in 2005 was $37.00. Protocol had 5,000 8 percent $1,000 par value convertible bonds that were issued in 2004. Each bond is convertible into 25 shares of common stock. Protocol, Inc.'s basic and diluted earnings per share for 2005 were closest to: BPS - EAT - Prejer stock dividend Basic EPS Diluted EPS it shakes $6.00 $5.45 Diluted EPS = EPS $5.19 $4.92 delutive - Com warrants $6.00 $4.92 3. Define internal and external sources of liquidity. What is a material deficiency in liquidity? If a firm has a material deficiency in liquidity what should be reported in the management discussion and analysis? 4. Using the following information analyze the accounts receivable and the allowance for doubtful accounts for this company: 20X9 20X8 Sales $8,800 $5,800 Accounts receivable, net 1,450 1,070 Allowance for doubtful accounts 22 26Exhibit 1 presents a statement of cash flows for Starbucks for 2006, 2007, and 2008. Required a. Explain why equity in income of investees appears as a subtraction when net income is converted to cash flow from operations. b. Compute the amount of cash received from investees as dividends each year. To answer this question, you need to refer to the income statement of Starbucks in Exhibit 2 c. Explain why stock-based compensation appears as an addition to net income to compute cash flow from operations. d. Discuss the relation between net income and cash flow from operations for each of the three years. e. Discuss the relation between cash flows from operating, investing, and financing activities for each of the three years. f. Refer to the income statement for Starbucks in Exhibit 1.27 in Chapter 1 (Integrative Case 1.1). Compute the amount of EBITDA for 2006, 2007, and 2008. g. Discuss the relationships among net income, non-working capital adjustments, working capital adjustments, operating cash flows, and EBITDA for the three years. Are the patterns similar or different? What are the primary determinants of the differences between the summary measures net income, operating cash flows, and EBITDA? h. The income statement in Exhibit 2 shows However, the statement of cash flows shows depreciation and amortization expense as addbacks for depreciation and amortization as follows: follows: 2007 2008 2006 2007 2008 2006 $387.2 $167.2 $549.3 $412.6 $491.2 $604.5 Explain why the amount on the income statement differs from the amount on the statement of cash flows each year Starbucks Corporation Comparative Statements of Cash Flows (amounts in millions):Sept. 28, Sept. 30, Oct. 1, Fiscal Year Ended: 2008 2007 2006 OPERATING ACTIVITIES Net earnings $ 315.5 $ 672.6 $ 564.3 Adjustments to reconcile net earnings to net cash provided by operating activities: Cumulative effect of accounting change for FIN 47, net of taxes 17.2 Depreciation and amortization 604.5 191.2 412.6 Provision for impairments and asset disposals 325.0 26.0 19.6 Deferred income taxes, net (117.1) (37.3) (84.3) Equity in income of investees (61.3) (65.7) (60.6) Distributions of income from equity investees 52.6 65.9 49.2 Stock-based compensation 75.0 103.9 105.7 Tax benefit from exercise of stock options 3.8 7.7 1.3 Excess tax benefit from exercise of stock options (14.7) (93.1) (117.4) Other (0.1) 0.7 2.0 Cash provided (used) by changes in operating assets and liabilities: Inventories (0.6) (48.6) (85.5) Accounts payable (63.9) 36.1 105.0 Accrued taxes 7.3 86.4 132.7 Deferred revenue 72.4 63.2 56.6 Other operating assets and liabilities 60.3 22.2 13.2 Net Cash Provided by Operating Activities $ 1,258.7 $ 1,331.2 $1,131.6 INVESTING ACTIVITIES Purchase of available-for-sale securities $ (71.8) S (237.4) $ (639.2) Maturity of available-for-sale securities 20.0 178.2 269.1 Sale of available-for-sale securities 75.9 47.5 431.2 Acquisitions, net of cash acquired (74.2) (53.3) (91.7) Net purchases of equity, other investments, and other assets (52.0) (56.6) (39.2) Net additions to property, plant, and equipment (984.5) (1,080.3) (771.2) Net Cash Used by Investing Activities $ (1,086.6) S (1,201.9) $ (841.0) FINANCING ACTIVITIES Repayments of commercial paper $(66,068.0) $(16,600.9) Proceeds from issuance of commercial paper 65,770.8 17,311.1 Repayments of short-term borrowings (228.8) (1,470.0) $ (993.1) Proceeds from short-term borrowings 528.2 770.0 1,416.1 Proceeds from issuance of common stock 112.3 176.9 159.2Sept. 28, Sept. 30, Oct. 1, Fiscal Year Ended: 2008 2007 2006 Excess tax benefit from exercise of stock options 14.7 93.1 117.4 Principal payments on long-term debt (0.6) (0.8) (0.9) Proceeds from issuance of long-term debt 549.0 Repurchase of common stock (311.4) (996.8) (854.0) Other (1.7) (3.5) Net Cash Used by Financing Activities $(184.5 $(171.9) $(155.3 Effect of exchange rate changes on cash and cash equivalents 0.9 11.3 3.5 Net increase (decrease) in cash and cash equivalents $ (11.5) S (31.3) $ 138.8 CASH AND CASH EQUIVALENTS Beginning of period 281.3 312.6 173.8 End of the Period $ 269.8 $ 281.3 $ 312.6 Exhibit 2: Starbucks Corporation Comparative Income Statements (amounts in millions except per share figures 2005 2006 2001 2009 Company-operated retail stores $5,391.9 $6,583.1 $7,998.3 $ 8,771.9 Specialty: Licensing 673.0 860.7 1,026.3 1,171.6 Foodservice and other 304.4 343.2 386.9 439.5 Total Specialty 977.4 1,203.9 1,413.2 1,611.1 Net Revenues $6,369.3 $7,787.0 $9,411.5 $10,383.0 Cost of sales including occupancy costs (2,605.2) (3,178.8) (3,999.1) (4,645.3) Gross Profit $3,764.1 $4,608.2 $5,412.4 $ 5,737.7 Store operating expenses (2,165.9) (2,687.8) (3,215.9) (3,745.1) Other operating expenses (192.5) (253.7) (294.1) (330.1) Depreciation and amortization / 340.2 387.2) 467.2 549.3 General and administrative expenses (361.6) (479.4) (189.2) (456.0) Restructuring charges 266.9 Income from equity investees (76.6) (93.9) (108.0) (113.6) Operating Income $ 780.5 $ 894.0 $1,054.0 S 503.9 Interest and other income 17.1 20.7 10.6 9.0 Interest expense (1.3) (8.4) (38.2 (53.4) Income Before Income Taxes $ 796.3 $ 906.3 $1,056.4 459.5 Provision for income taxes (302.0) (324.8) (383.7) (144.0) Cumulative effect of an accounting change (17.2) Net Income $ 494.3 $ 561.3 $ 672.7 315.5 Net Income Per Share Basic S 0.63 0.76 S 0.90 0.43 Diluted 5 0.61 0.73 0.87 0.43
Step by Step Solution
There are 3 Steps involved in it

Get step-by-step solutions from verified subject matter experts