Question: Part 1: Oscillators, Moving Averages Using the information in the following questions, explain whether these indicators, when taken together, signal an overall buy or sell,

Part 1: Oscillators, Moving Averages

Using the information in the following questions, explain whether these indicators, when taken together, signal an overall buy or sell, and explain why

1. Relative Strength (14) = 46, Money Flow Indicator = 49, MA (50) = 97, MA (200) = 98

2. Relative Strength (14) = 72, Money Flow Indicator = 91, MA (50) = 54, MA (200) = 52

3. Relative Strength (14) = 44, Money Flow Indicator = 71, MA (50) = 45, MA (200) = 38

4. Relative Strength (14) = 26, Money Flow Indicator = 17, MA (50) = 5, MA (200) = 10

5. Relative Strength (14) = 31, Money Flow Indicator = 32, MA (50) = 12, MA (200) = 17

Part 2: Charts

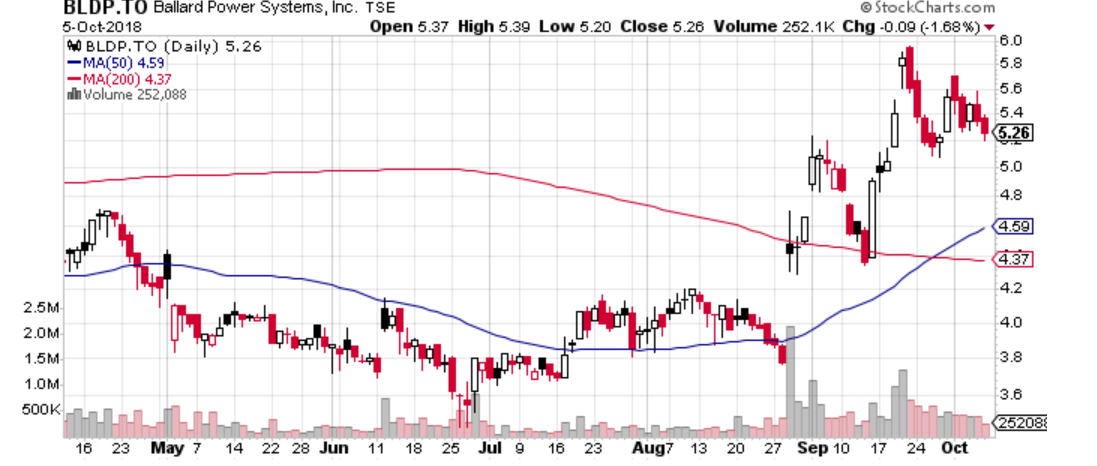
6. The following chart describes a stock's 6-month trading history. From mid-April to the end of August the trading pattern is reasonably uneventful. Using at least 4 signals based on any combination of indicators, trend lines, patterns or moving averages you see on the chart: a) describe how the stock has traded from the end of August until early October (4 marks); b) based on the majority of evidence you evaluated in part a, describe the probable direction in which the stock will move starting in mid-October

Part 1: Oscillators, Moving Averages Using thePart 1: Oscillators, Moving Averages Using thePart 1: Oscillators, Moving Averages Using the
BLDP.TO Ballard Power Systems, Inc. TSE @StockCharts.com 5-Oct-2018 Open 5.37 High 5.39 Low 5.20 Close 5.26 Volume 252.1K Chg -0.09 (-1.68%) 40 BLDP. TO (Daily) 5.26 6.0 -MA(50) 4.59 5.8 -MA(200) 4.37 win Volume 252,088 5.6 5.4 5.26 5.0 4.8 4.59 4.37 4.2 2.5M ECE 4.0 2.0M 1.5M 3.8 1.0M 3.6 500K 252081 16 23 May 7 14 22 28 Jun 11 18 25 Jul 9 16 23 Aug7 13 20 27 Sep 10 17 24 OctGUY.TO Guyana Goldfields, Inc. TSE @StockCharts.com 5-Oct-2018 Open 3.02 High 3.09 Low 2.98 Close 3.00 Volume 537.7K Chg -0.01 (-0.33%) - 40 GUY. TO (Daily) 3.00 5.4 - MA(50) 3.48 1 5.2 -MA(200) 4.53 in Volume 537,749 5.0 CUTTYI 4.8 48 4.53 4.4 4.2 4.0 3.8 3.6 20M 3.48 34 15M 3.2 10M 3.00 5M 2.8 53774 16 23 May 7 14 22 28 Jun 11 18 25 Jul 9 16 23 Aug7 13 20 27 Sep 10 17 24 OctWEED.TO Canopy Growth Corp. TSE StockCharts.com 15-Oct-2018 12:57pm Open 65.66 High 71.81 Low 65.53 Last 71.10 Volume 4.4M Chg +6.20 (+9.55%) - 1 WEED. TO (Daily) 71.10 75.0 - MA(50) 56.90 71.10 -MA(200) 39.27 67.5 in Volume 4,437,909 65.0 62.5 60.0 56.90 55.0 52.5 50.0 47.5 45.0 42.5 39.27 37.5 30M 25M 35.0 20M 32.5 15Ml 10M 30.0 5M 4437909 23 May 7 14 22 28 Jun 11 18 25 Jul 9 16 23 Aug7 13 20 27 Sep 10 17 24 Oct 9 15

Step by Step Solution

There are 3 Steps involved in it

1 Expert Approved Answer
Step: 1 Unlock blur-text-image
Question Has Been Solved by an Expert!

Get step-by-step solutions from verified subject matter experts

Step: 2 Unlock
Step: 3 Unlock

Students Have Also Explored These Related Finance Questions!