

Question: Part 1 Use SPSS to create a side-by-side box plot, descriptive statistics table and run the One-Way ANOVA for restBPM by the different levels of
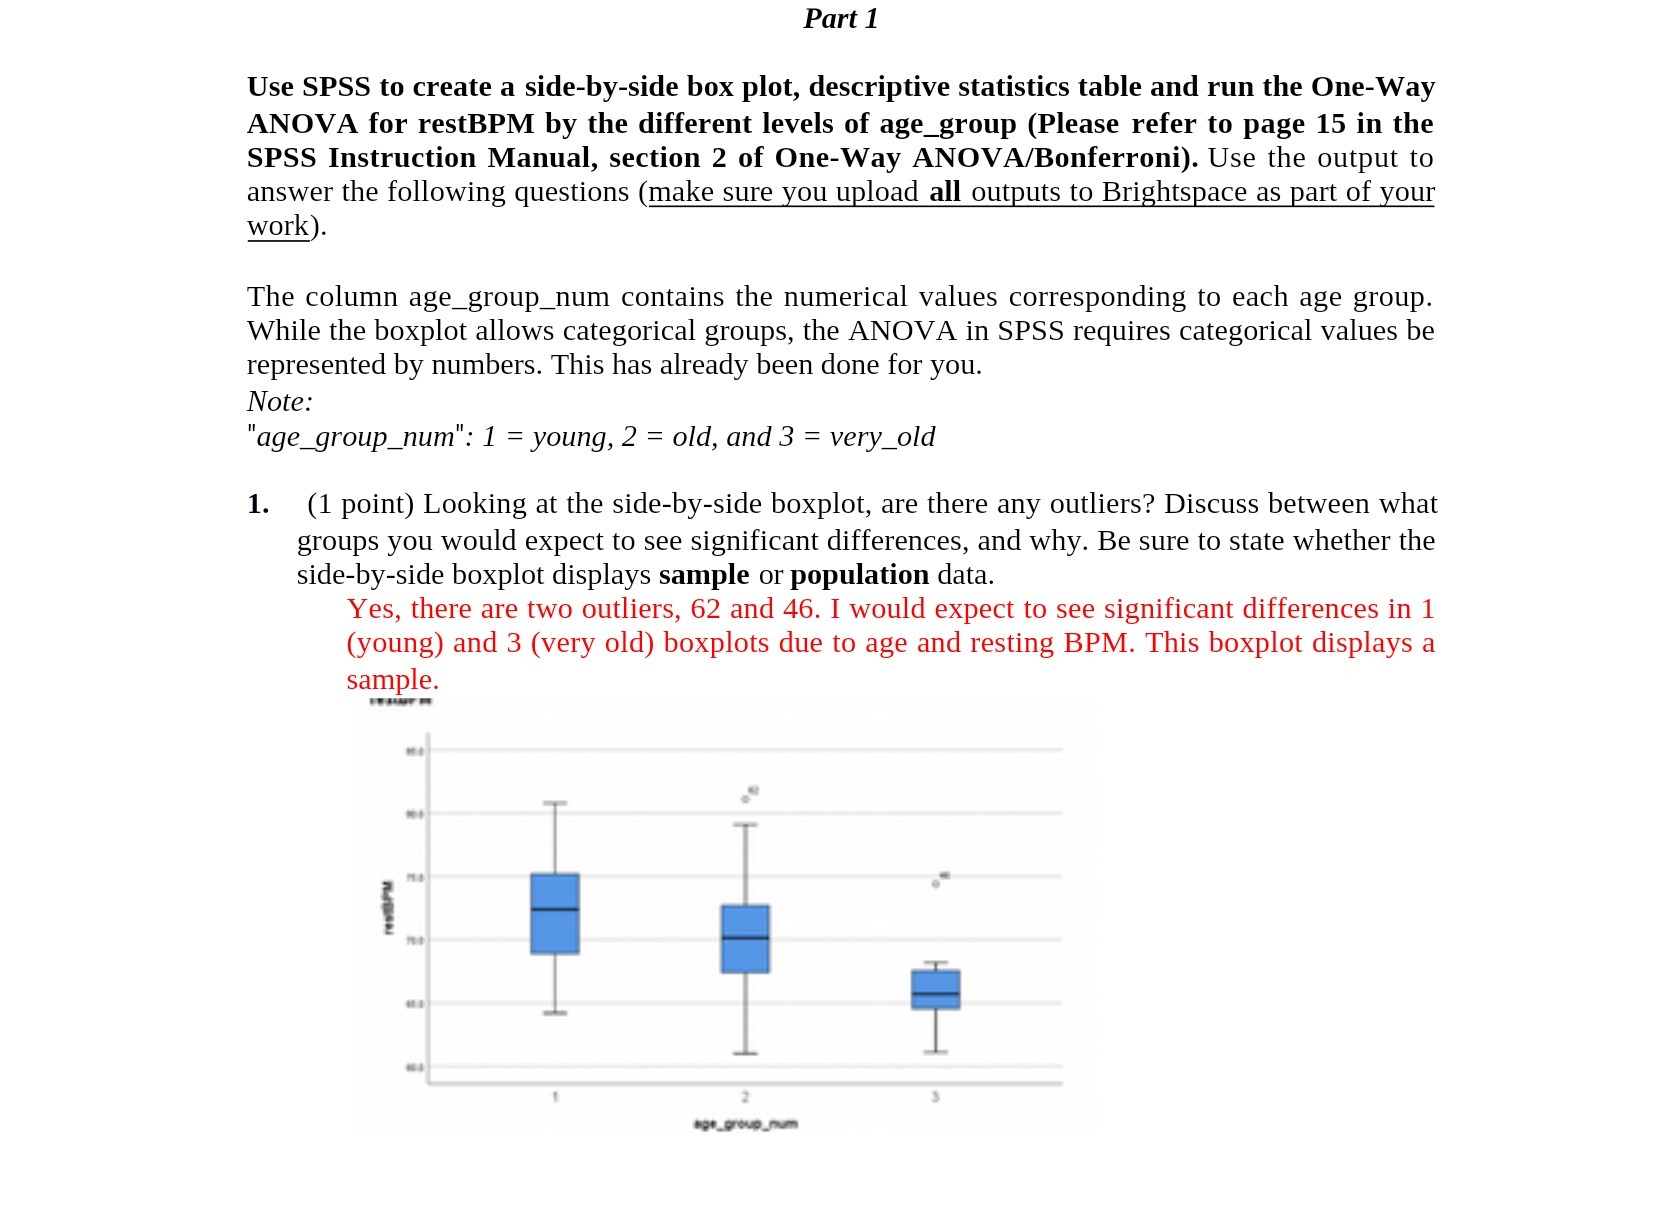
Part 1 Use SPSS to create a side-by-side box plot, descriptive statistics table and run the One-Way ANOVA for restBPM by the different levels of age_group (Please refer to page 15 in the SPSS Instruction Manual, section 2 of One-Way ANOVA/Bonferroni). Use the output to answer the following questions (make sure you upload all outputs to Brightspace as part of your work). The column age_group_num contains the numerical values corresponding to each age group. While the boxplot allows categorical groups, the ANOVA in SPSS requires categorical values be represented by numbers. This has already been done for you. Note: "age_group_num": 1 = young, 2 = old, and 3 = very_old 1. (1 point) Looking at the side-by-side boxplot, are there any outliers? Discuss between what groups you would expect to see significant differences, and why. Be sure to state whether the side-by-side boxplot displays sample or population data. Yes, there are two outliers, 62 and 46. I would expect to see significant differences in 1 (young) and 3 (very old) boxplots due to age and resting BPM. This boxplot displays a sample. #90_group_fam
Step by Step Solution
There are 3 Steps involved in it

Get step-by-step solutions from verified subject matter experts