

Question: Part 1 Using proper forecasting techniques (upside-down U), make a 5-year forecast for the catering business in the Year 6 Results tab of the spreadsheet.
Part 1
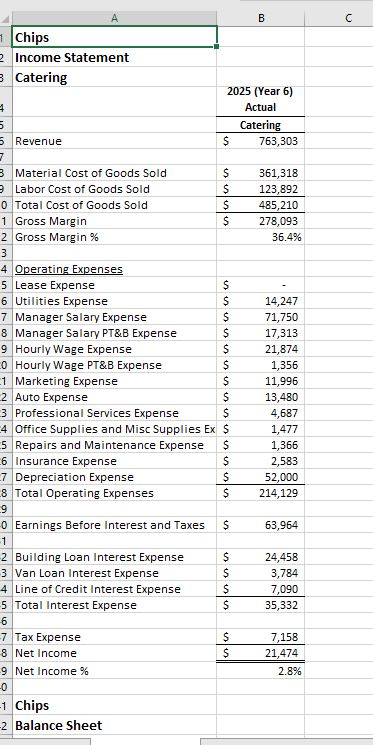
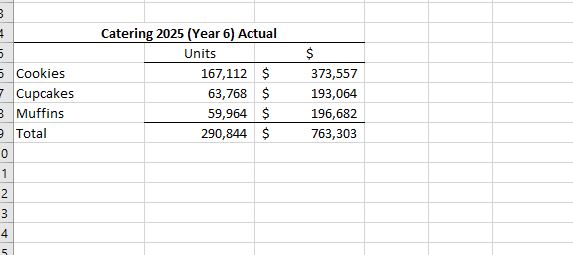
- Using proper forecasting techniques (upside-down U), make a 5-year forecast for the catering business in the Year 6 Results tab of the spreadsheet. The forecast should be for 2026-2030.Please add a column to the right of the forecast to explain your assumptions for each line item of the forecast.
- Insert rows above the financial statements to calculate ratios
- Forecast the changes for the ratios
- Forecast the financial statements
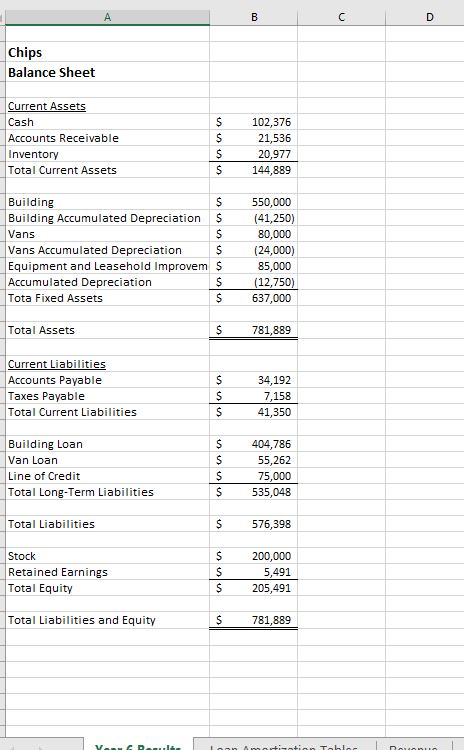
- Balance the balance sheet using the line of credit or cash line
- The forecast price per unit should stay the same as the 2025 actual price per unit for all 5 years of the forecast.
- The forecast for the number of units sold should increase by 1.0% each year.
- Calculate Cost of Goods Sold based on cost per unit. Past trends/CAGR from Cookie Store may be helpful in your forecast. Use your judgment to do the forecast.
- The depreciation expense should be calculated using the straight-line method and the following asset lives:
- Building?20 years.
- Vans?5 years.
- Equipment?10 years.
- Note that the depreciation expense line in the income statement is the total depreciation expense of the building, equipment, and vans. In the balance sheet, they are separated. You may want to set up a separate table to calculate depreciation expense. Remember that accumulated depreciation can be calculated using a formula of last year's accumulated depreciation - current year's depreciation expense.
- Note that the accumulated depreciation for 2025 includes 1.5 years of depreciation as this business started on July 1, 2024.
- The company will buy 3 new vans at the end of year 5 of the forecast with cash. The purchase ($150,000) will be at the end of the year, so there will be no depreciation expense for those 3 vans in the forecast.
- Remember that days of inventory and days of accounts payable should be based only on the material cost of goods sold.
- Tax Rate stays at 25%, and Taxes Payable should equal Tax Expense.
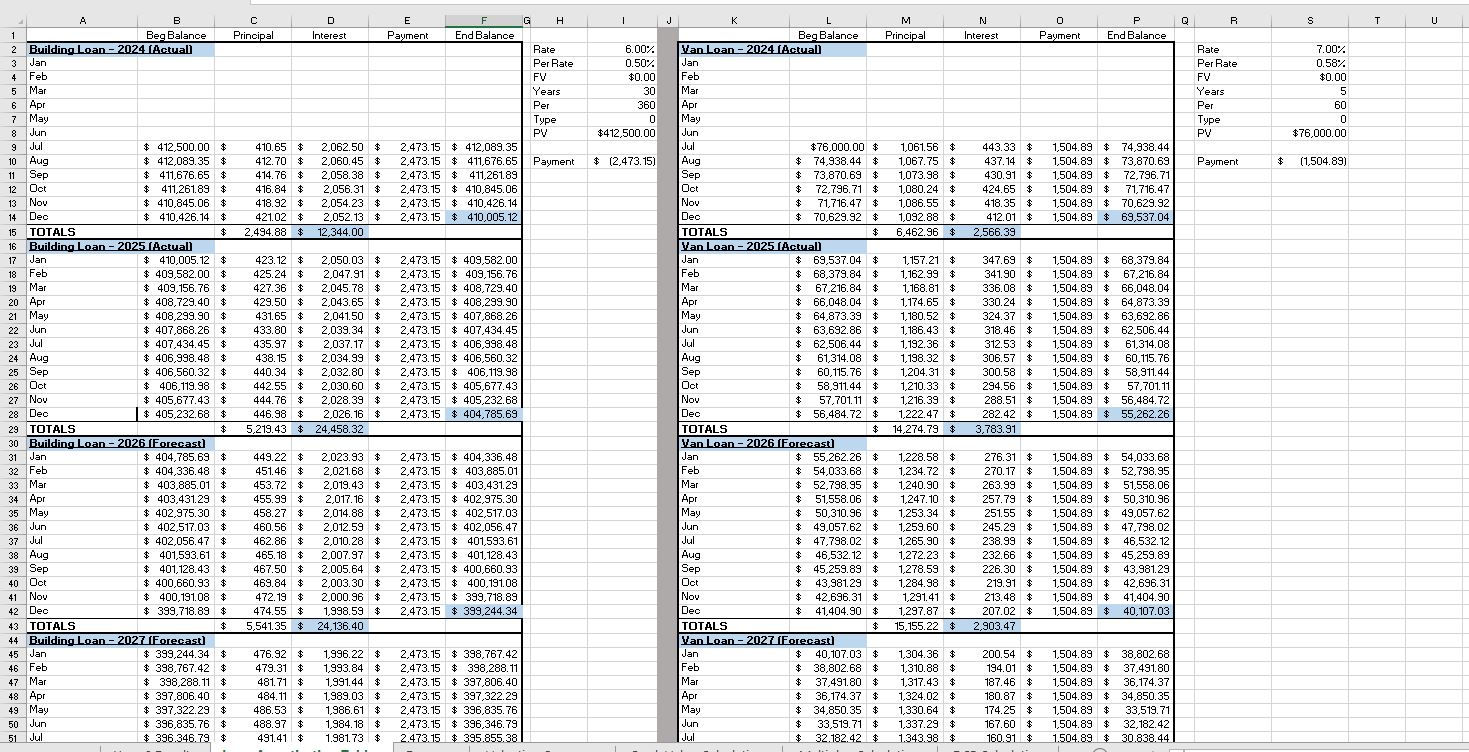
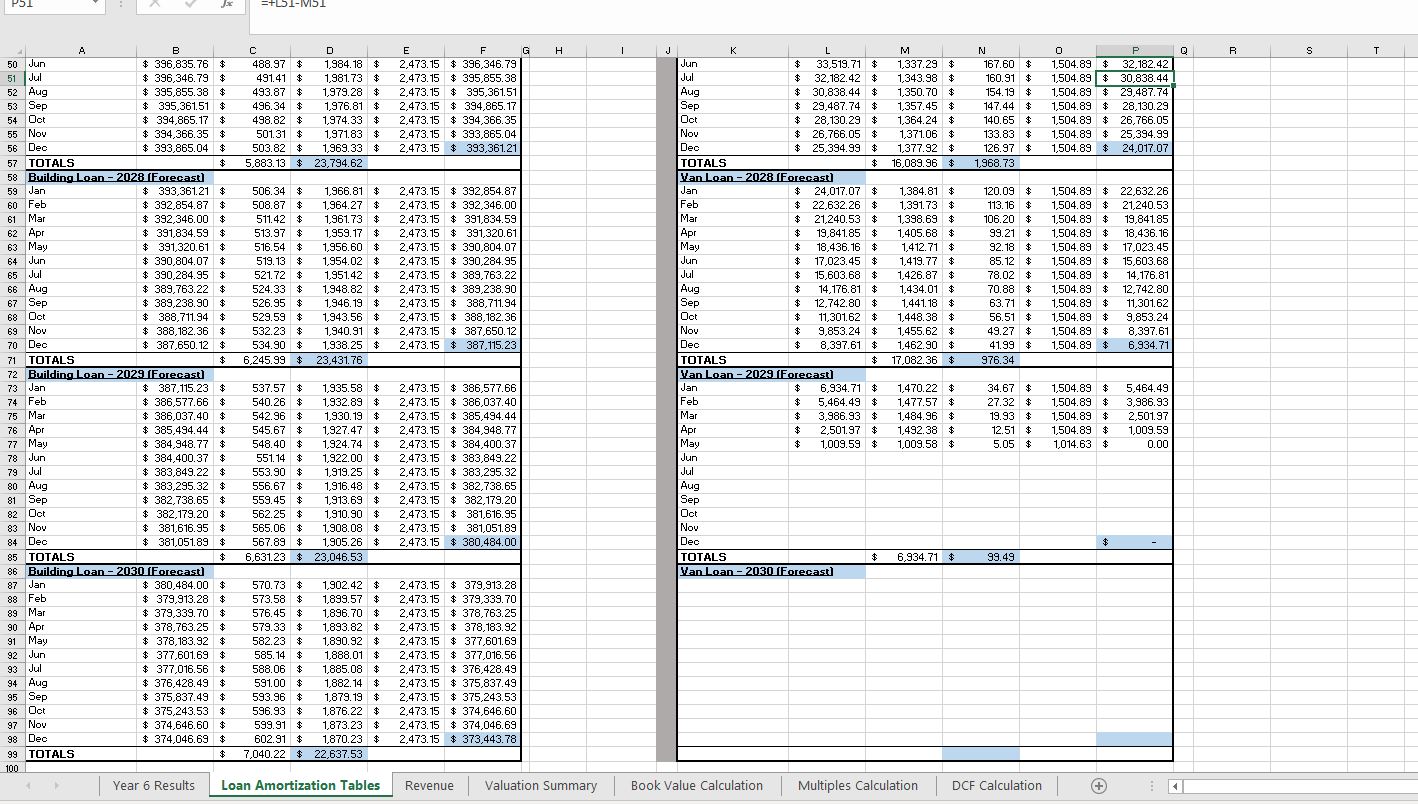
- Note that the "Loan Amortization Tables" tab of the spreadsheet includes the calculations of interest expense for each year of the forecast as well as the ending balance of the loan for each year of the forecast. The line of credit loan is an interest-only loan. The interest rates on the loan are 6% (Building), 7% (Vans), and 9% (Line of Credit).
- Use your judgment for all other pieces of the forecast. Remember to make sure the balance sheet is in balance.
Part 2
- Calculate the value of the catering business, using business valuation modeling. Perform the analysis, looking at quantitative and qualitative information. Decide upon an appropriate valuation of the business. Assume that the buyer would purchase all of the assets and assume all of the debt. Your analysis should include the following items:
- Book value calculation (based on 2025 actual financial statements).
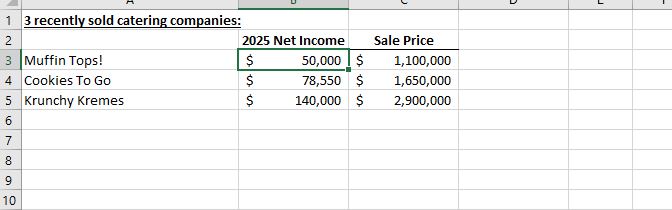
- Multiples calculation (based on 2025 actual financial statements) (Note: The "multiples calculation" tab includes information on 3 catering companies that were recently sold.)
- DCF calculation (based on the 5-year forecast). Use the WACC percentage of 7.55% as calculated previously. For terminal value, assume a sale of the company at the end of the forecast period for 10 times net profit in the last year of the forecast.
Please provide the calculations in the appropriate tabs of the spreadsheet, making clear the calculated valuation for each methodology. Then provide your final valuation of the company with a supporting explanation in the text box in the "Valuation Summary" tab.
Step by Step Solution
There are 3 Steps involved in it
1 Expert Approved Answer
Step: 1 Unlock

Question Has Been Solved by an Expert!
Get step-by-step solutions from verified subject matter experts
Step: 2 Unlock
Step: 3 Unlock