

Question: PART 1 : WALTER DIAGRAM ( 3 0 points ) Figure 1 . Walter diagram for the location discussed below. This location is in the
PART : WALTER DIAGRAM points
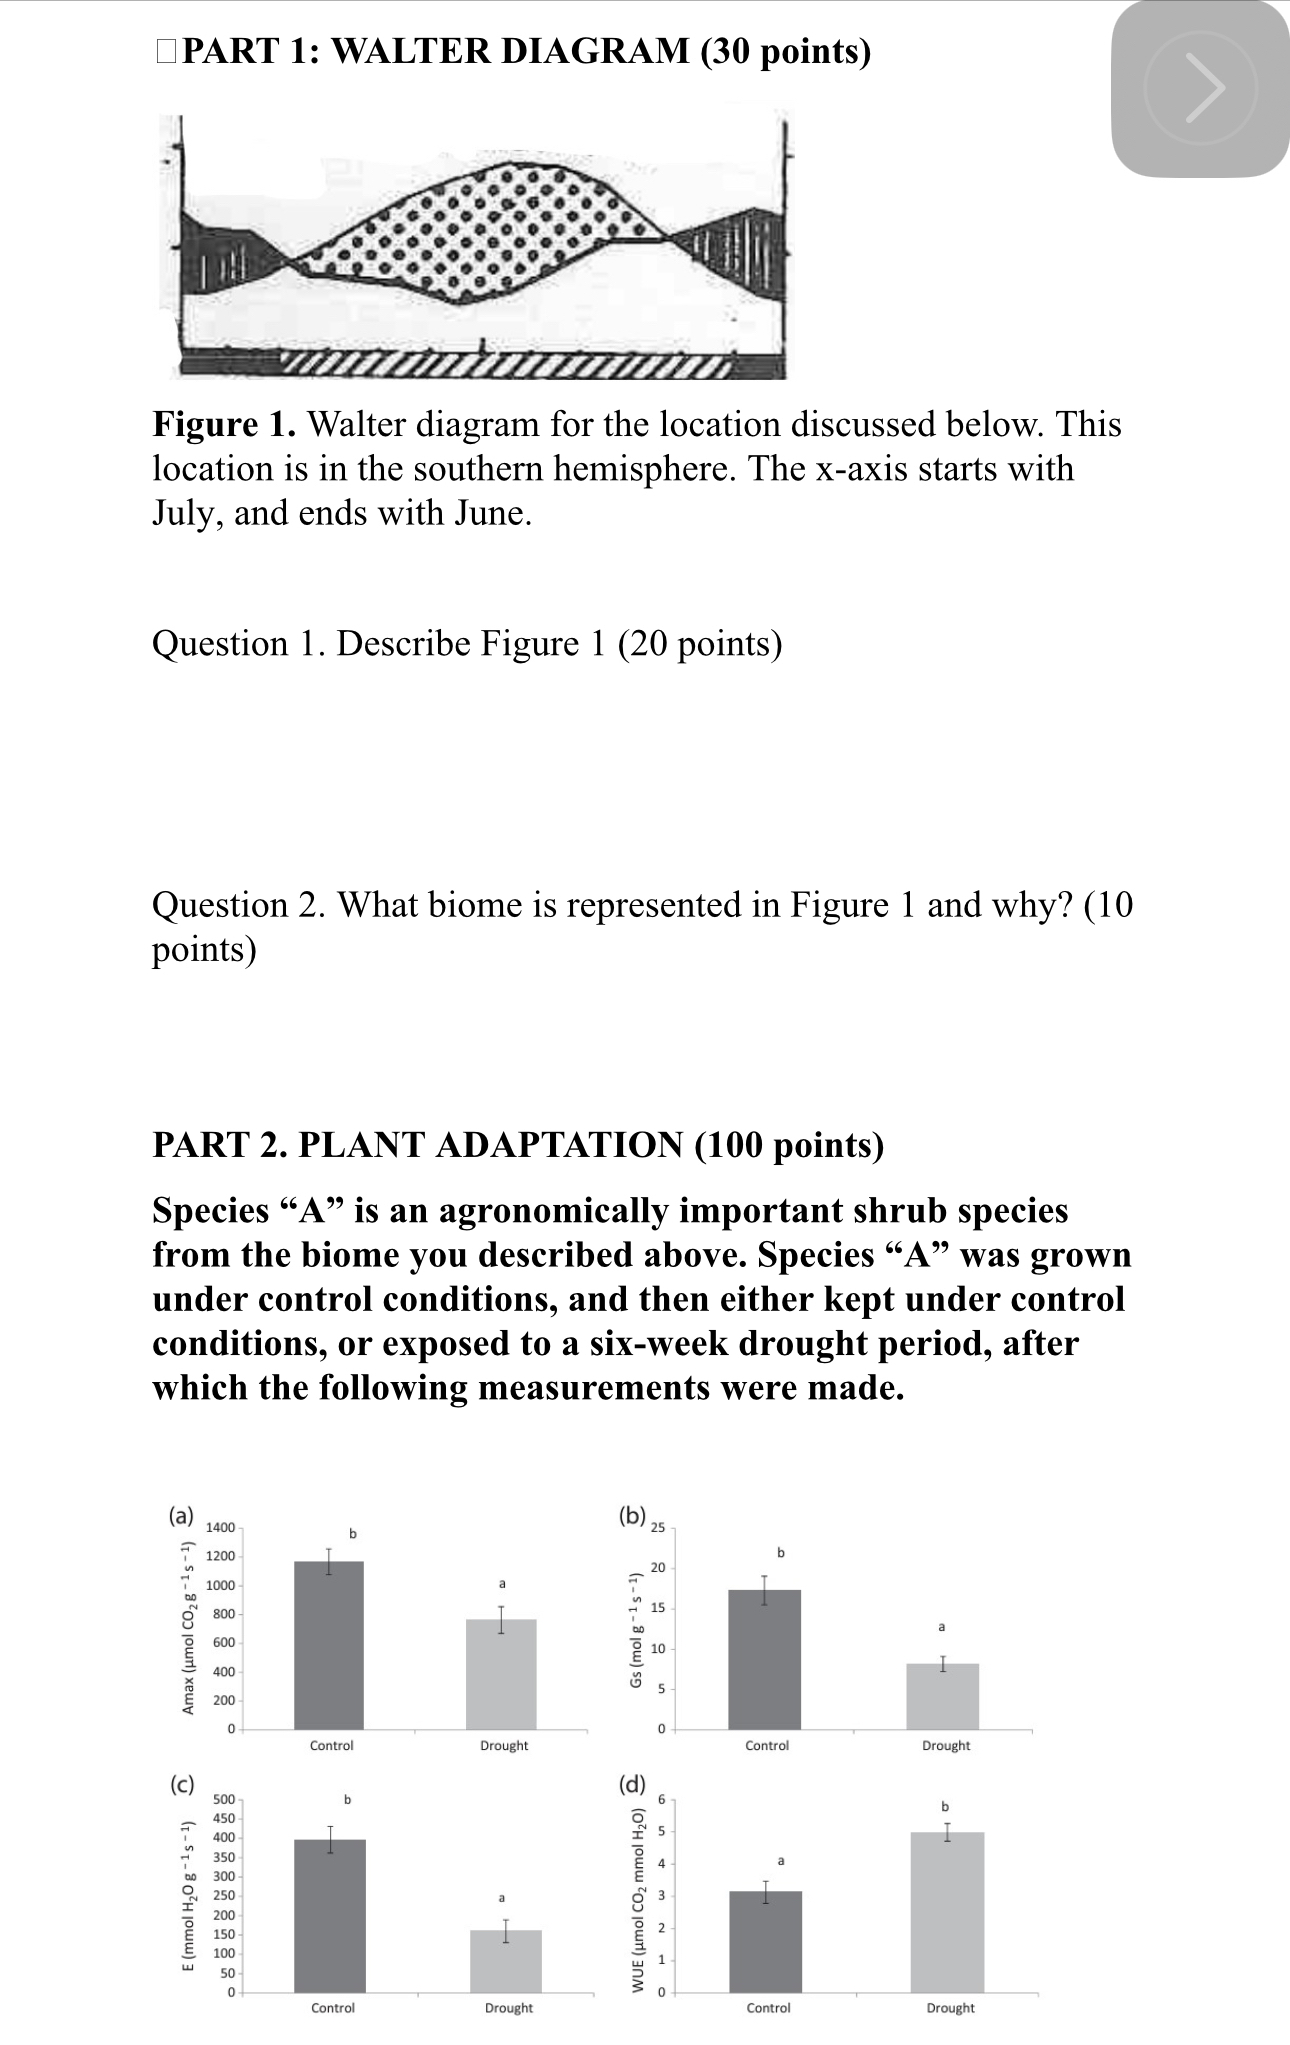
Figure Walter diagram for the location discussed below. This location is in the southern hemisphere. The x axis starts with July, and ends wit
PART : WALTER DIAGRAM h June.
Question Describe Figure points
Question What biome is represented in Figure and why? points
PART PLANT ADAPTATION points
Species is an agronomically important shrub species from the biome you described above. Species A was grown under control conditions, and then either kept under control conditions, or exposed to a sixweek drought period, after which the following measurements were made.PART : WALTER DIAGRAM points
Figure Walter diagram for the location discussed below. This location is in the southern hemisphere. The x axis starts with July, and ends with June.
Question Describe Figure points
Question What biome is represented in Figure and why? points
PART PLANT ADAPTATION points
Species is an agronomically important shrub species from the biome you described above. Species A was grown under control conditions, and then either kept under control conditions, or exposed to a sixweek drought period, after which the following measurements were made.
Figure Physiological response to drought of Species Aa Amax: maximum photosynthetic rate; b gs: stomatal conductance; c E: transpiration; dWUE: water use efficiency. Values represent means with standard error bars. Different letters denote significant differences at
Question: Describe Figure using one concise sentence. points
Table Relative growth rate of the whole plant, root only, and shoot stemleaves only of Species A Values represent means with standard error bars. Different letters denote significant differences at
Question Describe Table points
Question : The leaf of this plant is cultivated to make tea. Using results from Figure and Table in your answer, discuss how and why the production of tea is likely to be impacted by the droughts that are predicted to intensify because of climate change in this biome? points
Question : If the roots were the organ used for tea production instead of leaves how would the production be impacted by drought and why? points
Question : Based on the data from Figure d and Table explain whether this species is well suited to cope with drought ie survive drought and why. points
PART PLANT ADAPTATION points
Species s photosynthetic behavior is investigated in a biome that has a dry season year long.
Figure Species B photosynthetic responses CO throughout a h period. The dark bar on the x axis represents nighttime.
Question : Which biome species B is located in points
Question : Describe Figure points
Question : Based on results from Figure what adaptation has Species B evolved and in response to what environmental stress? points
Question : Based on results from Figure what adaptation has Species B evolved and in response to what environmental stress? points
Step by Step Solution
There are 3 Steps involved in it
1 Expert Approved Answer
Step: 1 Unlock

Question Has Been Solved by an Expert!
Get step-by-step solutions from verified subject matter experts
Step: 2 Unlock
Step: 3 Unlock