

Question: Part 2 (1) Application (28 marks) 1) Based on the data of some of the average bus waiting times over the course of a month,
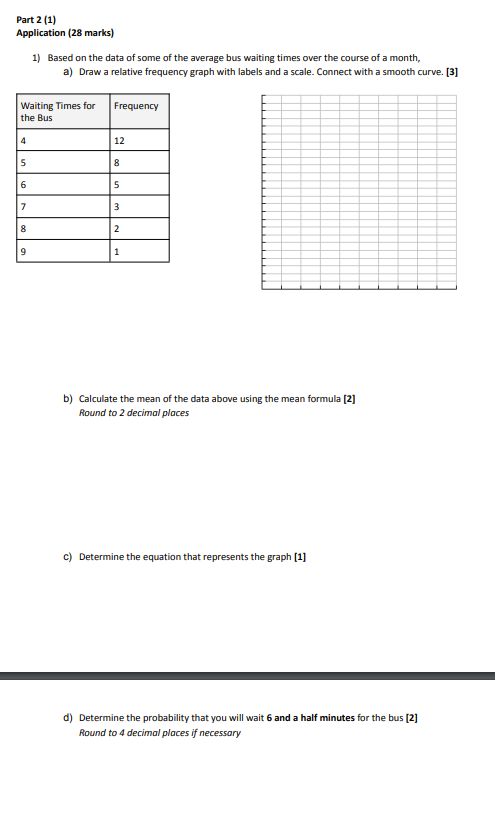
Part 2 (1) Application (28 marks) 1) Based on the data of some of the average bus waiting times over the course of a month, a) Draw a relative frequency graph with labels and a scale. Connect with a smooth curve. [3] Waiting Times for Frequency the Bus 12 5 3 2 1 b) Calculate the mean of the data above using the mean formula [2] Round to 2 decimal places c) Determine the equation that represents the graph [1] d) Determine the probability that you will wait 6 and a half minutes for the bus [2] Round to 4 decimal places if necessary
Step by Step Solution
There are 3 Steps involved in it
1 Expert Approved Answer
Step: 1 Unlock

Question Has Been Solved by an Expert!
Get step-by-step solutions from verified subject matter experts
Step: 2 Unlock
Step: 3 Unlock