

Question: Part 2: As noted in the case in Chapter 1, the supply chain worksheets provide cost data associated with logistics between existing plants and customers
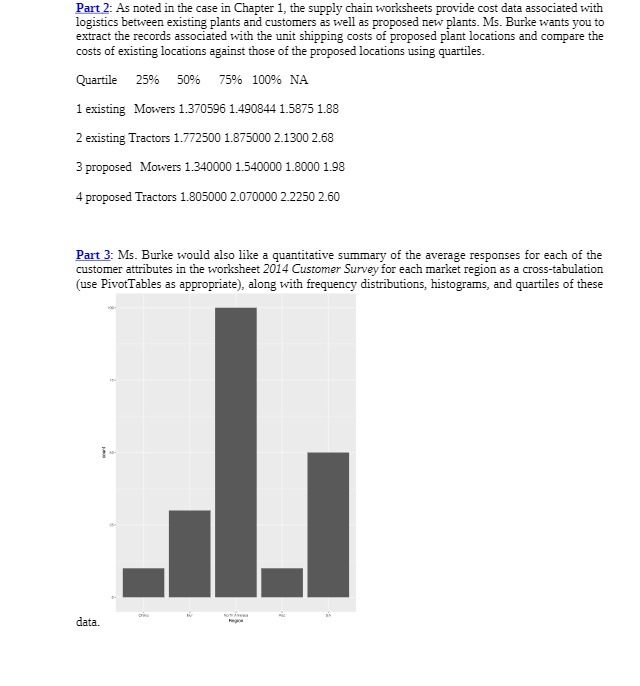
Part 2: As noted in the case in Chapter 1, the supply chain worksheets provide cost data associated with logistics between existing plants and customers as well as proposed new plants. Ms. Burke wants you to extract the records associated with the unit shipping costs of proposed plant locations and compare the costs of existing locations against those of the proposed locations using quartiles. Quartile 25% 50% 75% 100% NA 1 existing Mowers 1.370596 1.490844 1.5875 1.88 2 existing Tractors 1.772500 1.875000 2.1300 2.68 3 proposed Mowers 1.340000 1.540000 1.8000 1.98 4 proposed Tractors 1.805000 2.070000 2.2250 2.60 Part 3: Ms. Burke would also like a quantitative summary of the average responses for each of the customer attributes in the worksheet 2014 Customer Survey for each market region as a cross-tabulation (use PivotTables as appropriate), along with frequency distributions, histograms, and quartiles of these data
Step by Step Solution
There are 3 Steps involved in it

Get step-by-step solutions from verified subject matter experts