

Question: Part 2: Bayesian Updating (30 points) Failure Mode Distribution Mean Variance Alpha Beta Fail to Start Beta 2.24E-03 5.57E-06 0.91 400 Fail to Run Gamma
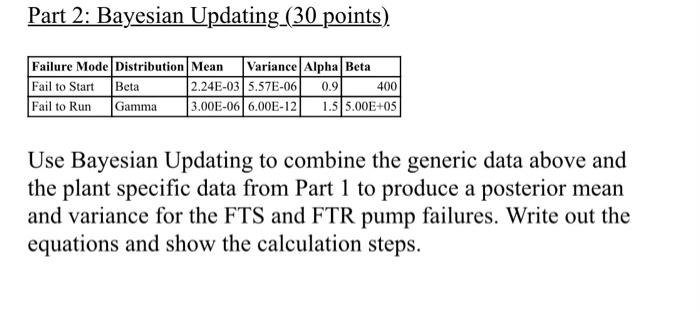
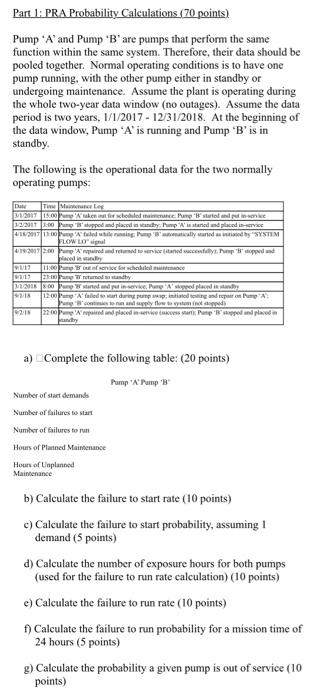
Part 2: Bayesian Updating (30 points) Failure Mode Distribution Mean Variance Alpha Beta Fail to Start Beta 2.24E-03 5.57E-06 0.91 400 Fail to Run Gamma 3.00E-06 6.00E-12 1.5 5.00E+05 Use Bayesian Updating to combine the generic data above and the plant specific data from Part 1 to produce a posterior mean and variance for the FTS and FTR pump failures. Write out the equations and show the calculation steps. Part 1: PRA Probability Calculations (70 points) Pump 'A' and Pump 'B' are pumps that perform the same function within the same system. Therefore, their data should be pooled together. Normal operating conditions is to have one pump running, with the other pump either in standby or undergoing maintenance. Assume the plant is operating during the whole two-year data window (no outages). Assume the data period is two years, 1/1/2017 - 12/31/2018. At the beginning of the data window, Pump 'A' is running and Pump 'B' is in standby. The following is the operational data for the two normally operating pumps: Date Time Maintenance Leg 3/5/2017 15:00 mp Ataken int for scheduled mainenance Pump 'B' started and put in-service 32/2017 3:00 amp stopped and placed in standby Pump 'A' is started and placed in-service 4/18/2017 13:00 'A' failed while running Pump 'B'automatically started as initiated by "SYSTEM FLOW LO signal 4192017 2:00 Pump 'A' repaired and returned to service (staned successfully Pump B stopped and laced in standy 92/17 11:00 amp out of service for scheduled muc W3/17 23:00 Pap returned to standby 3/1/2018 8:00 started and put in-service. Pung 'A' stopped placed in standby 9/3/18 12:00 Pamp"A' failed to start during pump swap, initiated testing and repair on Pump "A". ang continues to run and supply flow to system (not stopped) 92/18 22:00 Pump A repaired and placed in-service ticcess start) Pane B stopped and placed in andy a) Complete the following table: (20 points) Pump 'A' Pump B Number of start demands Number of failures to start Number of failures to run Hours of Planned Maintenance Hours of Unplanned Maintenance b) Calculate the failure to start rate (10 points) c) Calculate the failure to start probability, assuming 1 demand (5 points) d) Calculate the number of exposure hours for both pumps (used for the failure to run rate calculation) (10 points) e) Calculate the failure to run rate (10 points) f) Calculate the failure to run probability for a mission time of 24 hours (5 points) g) Calculate the probability a given pump is out of service (10 points) Part 2: Bayesian Updating (30 points) Failure Mode Distribution Mean Variance Alpha Beta Fail to Start Beta 2.24E-03 5.57E-06 0.91 400 Fail to Run Gamma 3.00E-06 6.00E-12 1.5 5.00E+05 Use Bayesian Updating to combine the generic data above and the plant specific data from Part 1 to produce a posterior mean and variance for the FTS and FTR pump failures. Write out the equations and show the calculation steps. Part 1: PRA Probability Calculations (70 points) Pump 'A' and Pump 'B' are pumps that perform the same function within the same system. Therefore, their data should be pooled together. Normal operating conditions is to have one pump running, with the other pump either in standby or undergoing maintenance. Assume the plant is operating during the whole two-year data window (no outages). Assume the data period is two years, 1/1/2017 - 12/31/2018. At the beginning of the data window, Pump 'A' is running and Pump 'B' is in standby. The following is the operational data for the two normally operating pumps: Date Time Maintenance Leg 3/5/2017 15:00 mp Ataken int for scheduled mainenance Pump 'B' started and put in-service 32/2017 3:00 amp stopped and placed in standby Pump 'A' is started and placed in-service 4/18/2017 13:00 'A' failed while running Pump 'B'automatically started as initiated by "SYSTEM FLOW LO signal 4192017 2:00 Pump 'A' repaired and returned to service (staned successfully Pump B stopped and laced in standy 92/17 11:00 amp out of service for scheduled muc W3/17 23:00 Pap returned to standby 3/1/2018 8:00 started and put in-service. Pung 'A' stopped placed in standby 9/3/18 12:00 Pamp"A' failed to start during pump swap, initiated testing and repair on Pump "A". ang continues to run and supply flow to system (not stopped) 92/18 22:00 Pump A repaired and placed in-service ticcess start) Pane B stopped and placed in andy a) Complete the following table: (20 points) Pump 'A' Pump B Number of start demands Number of failures to start Number of failures to run Hours of Planned Maintenance Hours of Unplanned Maintenance b) Calculate the failure to start rate (10 points) c) Calculate the failure to start probability, assuming 1 demand (5 points) d) Calculate the number of exposure hours for both pumps (used for the failure to run rate calculation) (10 points) e) Calculate the failure to run rate (10 points) f) Calculate the failure to run probability for a mission time of 24 hours (5 points) g) Calculate the probability a given pump is out of service (10 points)
Step by Step Solution
There are 3 Steps involved in it

Get step-by-step solutions from verified subject matter experts