

Question: Part 2 - Break-even and What-if Analysis DATA SECTION (ONE FOR EACH SCENARIO, SIX SCENARIOS) Make data labels common for all data, looking somewhat
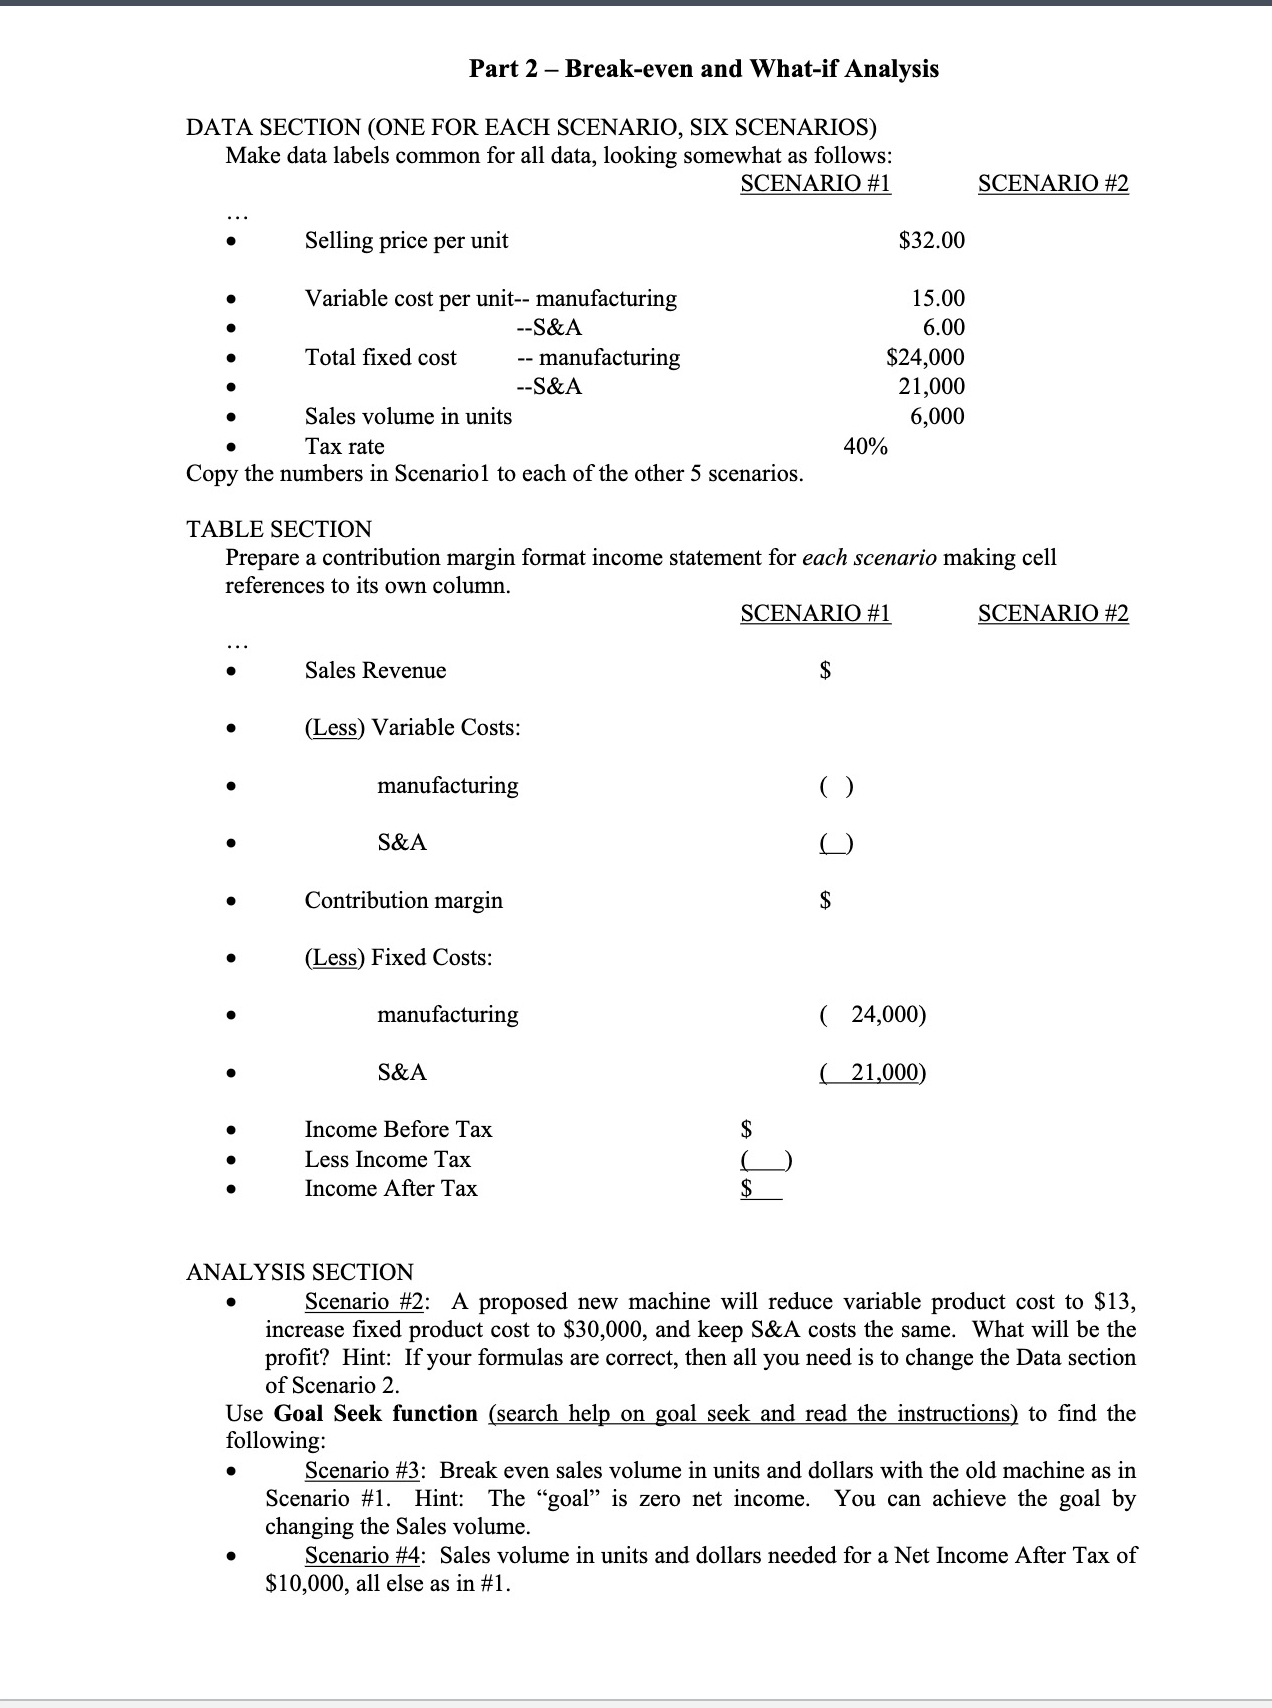
Part 2 - Break-even and What-if Analysis DATA SECTION (ONE FOR EACH SCENARIO, SIX SCENARIOS) Make data labels common for all data, looking somewhat as follows: SCENARIO #1 Selling price per unit Variable cost per unit-- manufacturing --S&A Total fixed cost -- manufacturing --S&A Sales volume in units Tax rate Copy the numbers in Scenariol to each of the other 5 scenarios. TABLE SECTION SCENARIO #2 $32.00 15.00 6.00 $24,000 21,000 6,000 40% Prepare a contribution margin format income statement for each scenario making cell references to its own column. SCENARIO #1 $ . Sales Revenue (Less) Variable Costs: ( ) manufacturing S&A Contribution margin (Less) Fixed Costs: manufacturing () C G A ( 24,000) S&A ( 21,000) Income Before Tax $ Less Income Tax Income After Tax $ SCENARIO #2 ANALYSIS SECTION Scenario #2: A proposed new machine will reduce variable product cost to $13, increase fixed product cost to $30,000, and keep S&A costs the same. What will be the profit? Hint: If your formulas are correct, then all you need is to change the Data section of Scenario 2. Use Goal Seek function (search help on goal seek and read the instructions) to find the following: Scenario #3: Break even sales volume in units and dollars with the old machine as in Scenario #1. Hint: The "goal" is zero net income. You can achieve the goal by changing the Sales volume. Scenario #4: Sales volume in units and dollars needed for a Net Income After Tax of $10,000, all else as in #1.
Step by Step Solution
There are 3 Steps involved in it

Get step-by-step solutions from verified subject matter experts