

Question: Part 2 Consider the endogenous growth model in which time can be used for work (it) or human capital accumulation (1 15). Output is produced
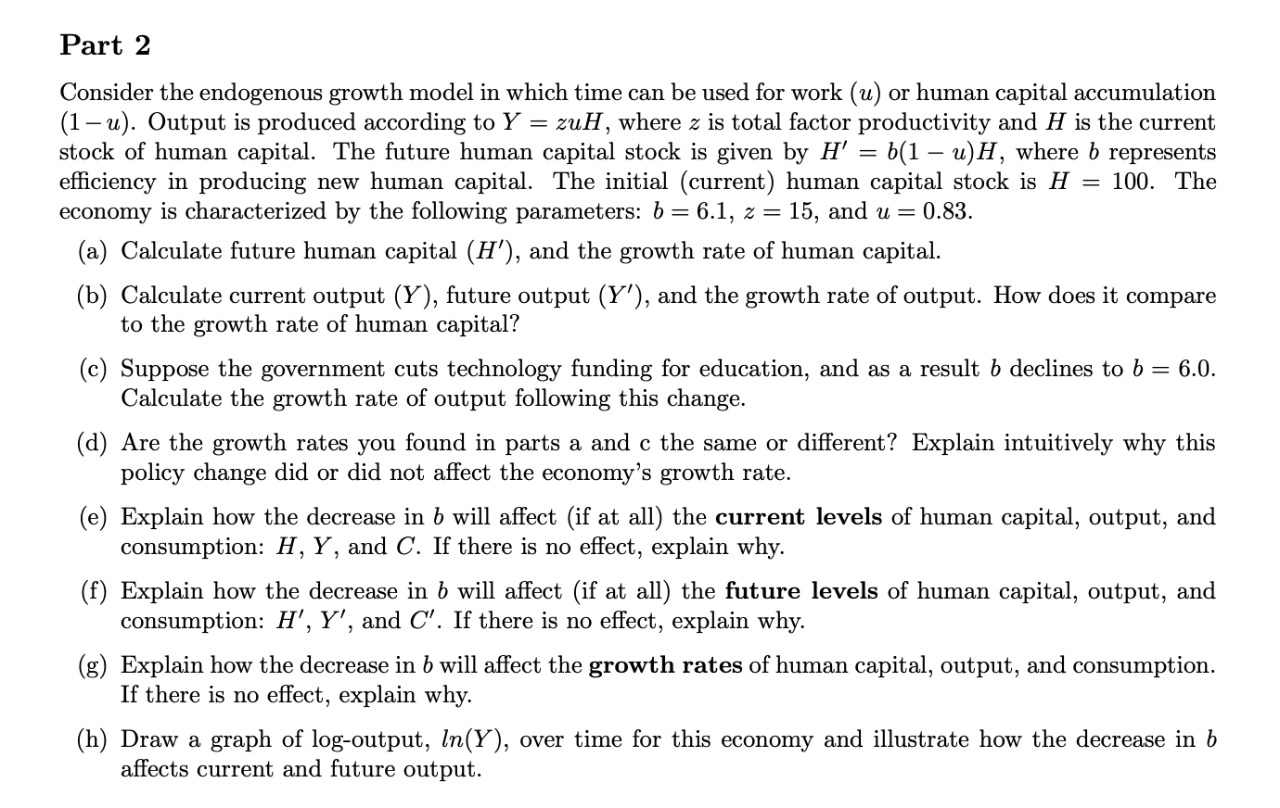
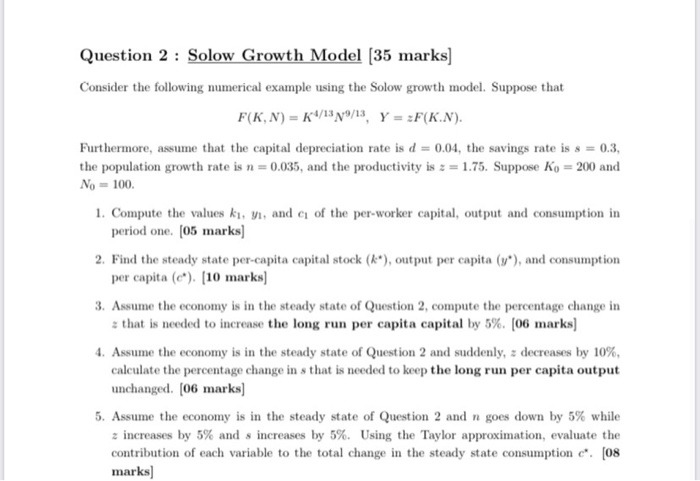
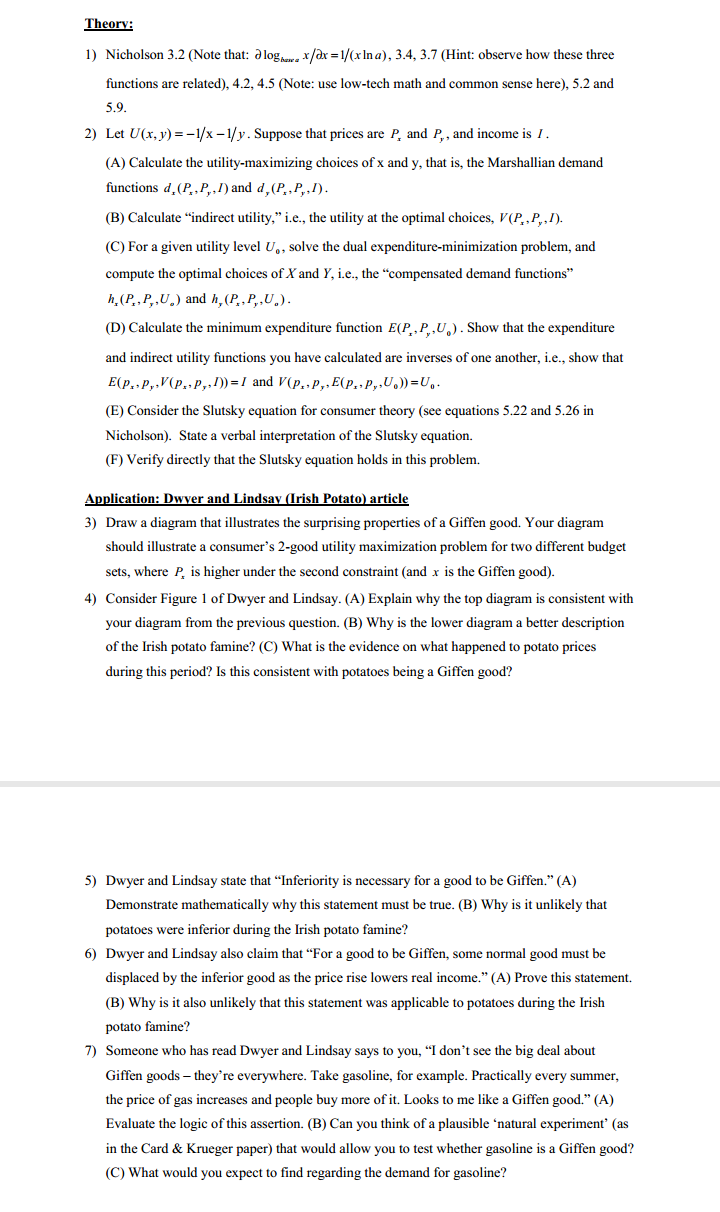
Part 2 Consider the endogenous growth model in which time can be used for work (it) or human capital accumulation (1 15). Output is produced according to Y = zuH, where z is total factor productivity and H is the current stock of human capital. The future human capital stock is given by H ' = M] u)H, where 5 represents eiciency in producing new human capital. The initial (current) human capital stock is H = 100. The economy is characterized by the following parameters: b = 6.1, 2 = 15, and u = 0.83. (a) Calculate future human capital (H '), and the growth rate of human capital. (b) Calculate current output (Y), future output (1\"), and the growth rate of output. How does it compare to the growth rate of human capital? (c) Suppose the government cuts technology funding for education, and as a result b declines to b = 6.0. Calculate the growth rate of output following this change. ((1) Are the growth rates you found in parts a and c the same or different? Explain intuitively why this policy change did or did not a'ect the economy's growth rate. (e) Explain how the decrease in b will affect (if at all) the current levels of human capital, output, and consumption: H, Y, and C. If there is no effect, explain why. (f) Explain how the decrease in b will affect (if at all) the future levels of human capital, output, and consumption: H', Y' , and C' . If there is no effect, explain why. (g) Explain how the decrease in b will affect the growth rates of human capital, output, and consumption. If there is no effect, explain why. (h) Draw a graph of logoutput, ln'), over time for this economy and illustrate how the decrease in b affects current and future output. Question 2 : Solow Growth Model [35 marks] Consider the following numerical example using the Solow growth model. Suppose that F(K, N) = KI/13N9/13, Y = =F(K.N). Furthermore, assume that the capital depreciation rate is d = 0.04, the savings rate is s = 0.3, the population growth rate is n = 0.035, and the productivity is = = 1.75. Suppose Ko = 200 and No = 100. 1. Compute the values ki, vi, and e of the per-worker capital, output and consumption in period one. [05 marks] 2. Find the steady state per-capita capital stock (k*), output per capita (y"), and consumption per capita (c"). [10 marks] 3. Assume the economy is in the steady state of Question 2, compute the percentage change in = that is needed to increase the long run per capita capital by 5%. [06 marks] 4. Assume the economy is in the steady state of Question 2 and suddenly, = decreases by 10%, calculate the percentage change in s that is needed to keep the long run per capita output unchanged. [06 marks] 5. Assume the economy is in the steady state of Question 2 and n goes down by 5% while z increases by 5% and s increases by 5%. Using the Taylor approximation, evaluate the contribution of each variable to the total change in the steady state consumption c". [08 marks]Theory: 1) Nicholson 3.2 (Note that: a log... x/ax =1/(xIna), 3.4, 3.7 (Hint: observe how these three functions are related), 4.2, 4.5 (Note: use low-tech math and common sense here), 5.2 and 5.9. 2) Let U(x, y) = -1/x -1/y . Suppose that prices are P, and P., and income is I . (A) Calculate the utility-maximizing choices of x and y, that is, the Marshallian demand functions d, (P,, P,, I) and d, (P., P,, 1). (B) Calculate "indirect utility," i.e., the utility at the optimal choices, V(P, , P. , I). (C) For a given utility level U., solve the dual expenditure-minimization problem, and compute the optimal choices of X and Y, i.e., the "compensated demand functions" h, (P,, P,, U. ) and h, (P, P,, U.). D) Calculate the minimum expenditure function E(P,, P., U.) . Show that the expenditure and indirect utility functions you have calculated are inverses of one another, i.e., show that E(P. . P,, V(P:, P,; D)= I and V(P, , P,, E(P.,P,,U.))=U.. (E) Consider the Slutsky equation for consumer theory (see equations 5.22 and 5.26 in Nicholson). State a verbal interpretation of the Slutsky equation. (F) Verify directly that the Slutsky equation holds in this problem. Application: Dwyer and Lindsay (Irish Potato) article 3) Draw a diagram that illustrates the surprising properties of a Giffen good. Your diagram should illustrate a consumer's 2-good utility maximization problem for two different budget sets, where P, is higher under the second constraint (and x is the Giffen good). 4) Consider Figure 1 of Dwyer and Lindsay. (A) Explain why the top diagram is consistent with your diagram from the previous question. (B) Why is the lower diagram a better description of the Irish potato famine? (C) What is the evidence on what happened to potato prices during this period? Is this consistent with potatoes being a Giffen good? 5) Dwyer and Lindsay state that "Inferiority is necessary for a good to be Giffen." (A) Demonstrate mathematically why this statement must be true. (B) Why is it unlikely that potatoes were inferior during the Irish potato famine? 6) Dwyer and Lindsay also claim that "For a good to be Giffen, some normal good must be displaced by the inferior good as the price rise lowers real income." (A) Prove this statement. (B) Why is it also unlikely that this statement was applicable to potatoes during the Irish potato famine? 7) Someone who has read Dwyer and Lindsay says to you, "I don't see the big deal about Giffen goods - they're everywhere. Take gasoline, for example. Practically every summer, the price of gas increases and people buy more of it. Looks to me like a Giffen good." (A) Evaluate the logic of this assertion. (B) Can you think of a plausible 'natural experiment' (as in the Card & Krueger paper) that would allow you to test whether gasoline is a Giffen good? (C) What would you expect to find regarding the demand for gasoline
Step by Step Solution
There are 3 Steps involved in it

Get step-by-step solutions from verified subject matter experts