

Question: Part 2 Every hour, a random sample of two small boxes is collected and the weight of each box is measured. Results from 7 samples:
Part
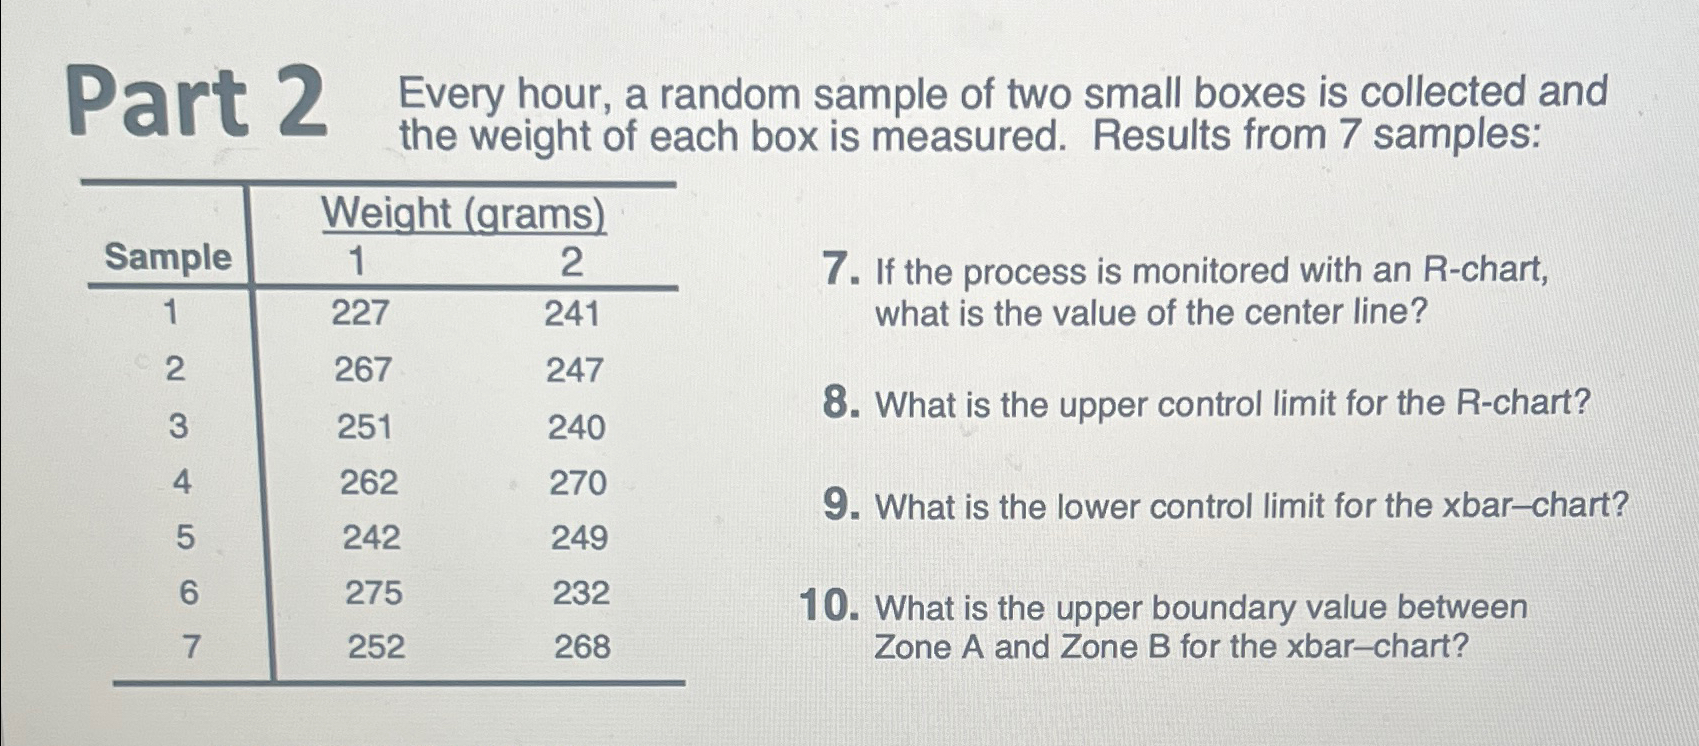
Every hour, a random sample of two small boxes is collected and the weight of each box is measured. Results from samples:
tableWeight gramsSample
If the process is monitored with an Rchart, what is the value of the center line?
What is the upper control limit for the Rchart?
What is the lower control limit for the xbarchart?
What is the upper boundary value between Zone A and Zone for the xbarchart?
Step by Step Solution
There are 3 Steps involved in it
1 Expert Approved Answer
Step: 1 Unlock

Question Has Been Solved by an Expert!
Get step-by-step solutions from verified subject matter experts
Step: 2 Unlock
Step: 3 Unlock