

Question: Part 2 [Forecasting with averages] The following table shows the Bank of Canada average exchange rate for the Singapore Dollar in the months June to
![Part 2 [Forecasting with averages] The following table shows the Bank](https://dsd5zvtm8ll6.cloudfront.net/si.experts.images/questions/2024/10/671456e14604d_208671456e0bf284.jpg)
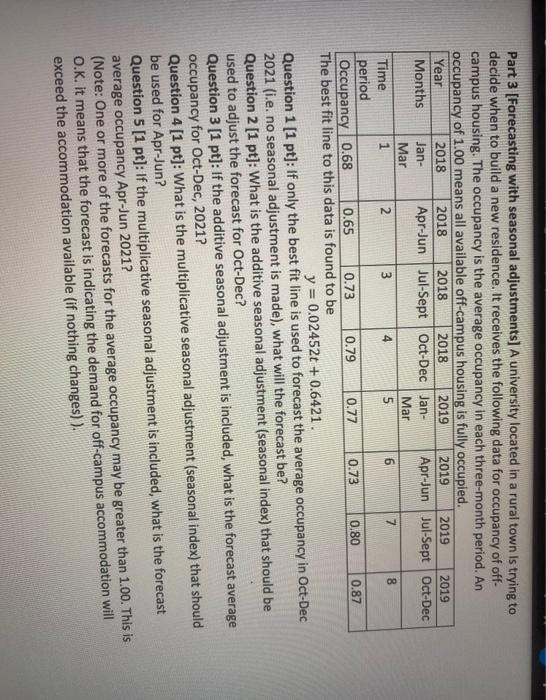
Part 2 [Forecasting with averages] The following table shows the Bank of Canada average exchange rate for the Singapore Dollar in the months June to October 2020 (https://www.bankofcanada.ca/rates/exchange/monthly-exchange rates/). Month June July August September October Rate (CDN S/S$) 0.9732 0.9733 0.9659 0.9684 0.9719 Question 1 [1 pt] What is the forecast value of the exchange rate for November, if a simple average is used for forecasting? Question 2 (1 pt] What is the forecast value of the exchange rate for November, if a 2-point moving average is used for forecasting? Question 3 [1 pt] What is the forecast value of the exchange rate for November, if a 3-point moving average is used for forecasting? Question 4 [1 pt) Based on the months of September and October, what is the SSE for the simple average forecasts? Question 5 [1 pt] Based on the months of September and October, are the simple average forecasts or the 3-point moving average forecasts the best fit to the data? Part 3 [Forecasting with seasonal adjustments] A university located in a rural town is trying to decide when to build a new residence. It receives the following data for occupancy of off- campus housing. The occupancy is the average occupancy in each three-month period. An occupancy of 1.00 means all available off-campus housing is fully occupied. Year 2018 2018 2018 2018 2019 2019 2019 2019 Months Jan Apr-Jun Jul-Sept Oct-Dec Jan Apr-Jun Jul-Sept Oct-Dec Mar Mar Time 1 2 3 4 5 6 7 8 period Occupancy 0.68 0.65 0.73 0.79 0.77 0.73 0.80 0.87 The best fit line to this data is found to be y = 0.02452t + 0.6421. Question 1 (1 pt]: If only the best fit line is used to forecast the average occupancy in Oct-Dec 2021 (i.e. no seasonal adjustment is made), what will the forecast be? Question 2 [1 pt): What is the additive seasonal adjustment (seasonal index) that should be used to adjust the forecast for Oct-Dec? Question 3 (1 pt]: If the additive seasonal adjustment is included, what is the forecast average occupancy for Oct-Dec, 2021? Question 4 (1 pt]: What is the multiplicative seasonal adjustment (seasonal index) that should be used for Apr-Jun? Question 5 [1 pt]: If the multiplicative seasonal adjustment is included, what is the forecast average occupancy Apr-Jun 2021? (Note: One or more of the forecasts for the average occupancy may be greater than 1.00. This is O.K. it means that the forecast is indicating the demand for off-campus accommodation will exceed the accommodation available (if nothing changes)). Part 2 [Forecasting with averages] The following table shows the Bank of Canada average exchange rate for the Singapore Dollar in the months June to October 2020 (https://www.bankofcanada.ca/rates/exchange/monthly-exchange rates/). Month June July August September October Rate (CDN S/S$) 0.9732 0.9733 0.9659 0.9684 0.9719 Question 1 [1 pt] What is the forecast value of the exchange rate for November, if a simple average is used for forecasting? Question 2 (1 pt] What is the forecast value of the exchange rate for November, if a 2-point moving average is used for forecasting? Question 3 [1 pt] What is the forecast value of the exchange rate for November, if a 3-point moving average is used for forecasting? Question 4 [1 pt) Based on the months of September and October, what is the SSE for the simple average forecasts? Question 5 [1 pt] Based on the months of September and October, are the simple average forecasts or the 3-point moving average forecasts the best fit to the data? Part 3 [Forecasting with seasonal adjustments] A university located in a rural town is trying to decide when to build a new residence. It receives the following data for occupancy of off- campus housing. The occupancy is the average occupancy in each three-month period. An occupancy of 1.00 means all available off-campus housing is fully occupied. Year 2018 2018 2018 2018 2019 2019 2019 2019 Months Jan Apr-Jun Jul-Sept Oct-Dec Jan Apr-Jun Jul-Sept Oct-Dec Mar Mar Time 1 2 3 4 5 6 7 8 period Occupancy 0.68 0.65 0.73 0.79 0.77 0.73 0.80 0.87 The best fit line to this data is found to be y = 0.02452t + 0.6421. Question 1 (1 pt]: If only the best fit line is used to forecast the average occupancy in Oct-Dec 2021 (i.e. no seasonal adjustment is made), what will the forecast be? Question 2 [1 pt): What is the additive seasonal adjustment (seasonal index) that should be used to adjust the forecast for Oct-Dec? Question 3 (1 pt]: If the additive seasonal adjustment is included, what is the forecast average occupancy for Oct-Dec, 2021? Question 4 (1 pt]: What is the multiplicative seasonal adjustment (seasonal index) that should be used for Apr-Jun? Question 5 [1 pt]: If the multiplicative seasonal adjustment is included, what is the forecast average occupancy Apr-Jun 2021? (Note: One or more of the forecasts for the average occupancy may be greater than 1.00. This is O.K. it means that the forecast is indicating the demand for off-campus accommodation will exceed the accommodation available (if nothing changes))
Step by Step Solution
There are 3 Steps involved in it

Get step-by-step solutions from verified subject matter experts