

Question: Part 2 - Graph It- The demand schedule below is for soda from a vending machine in a local park. The data was compiled over
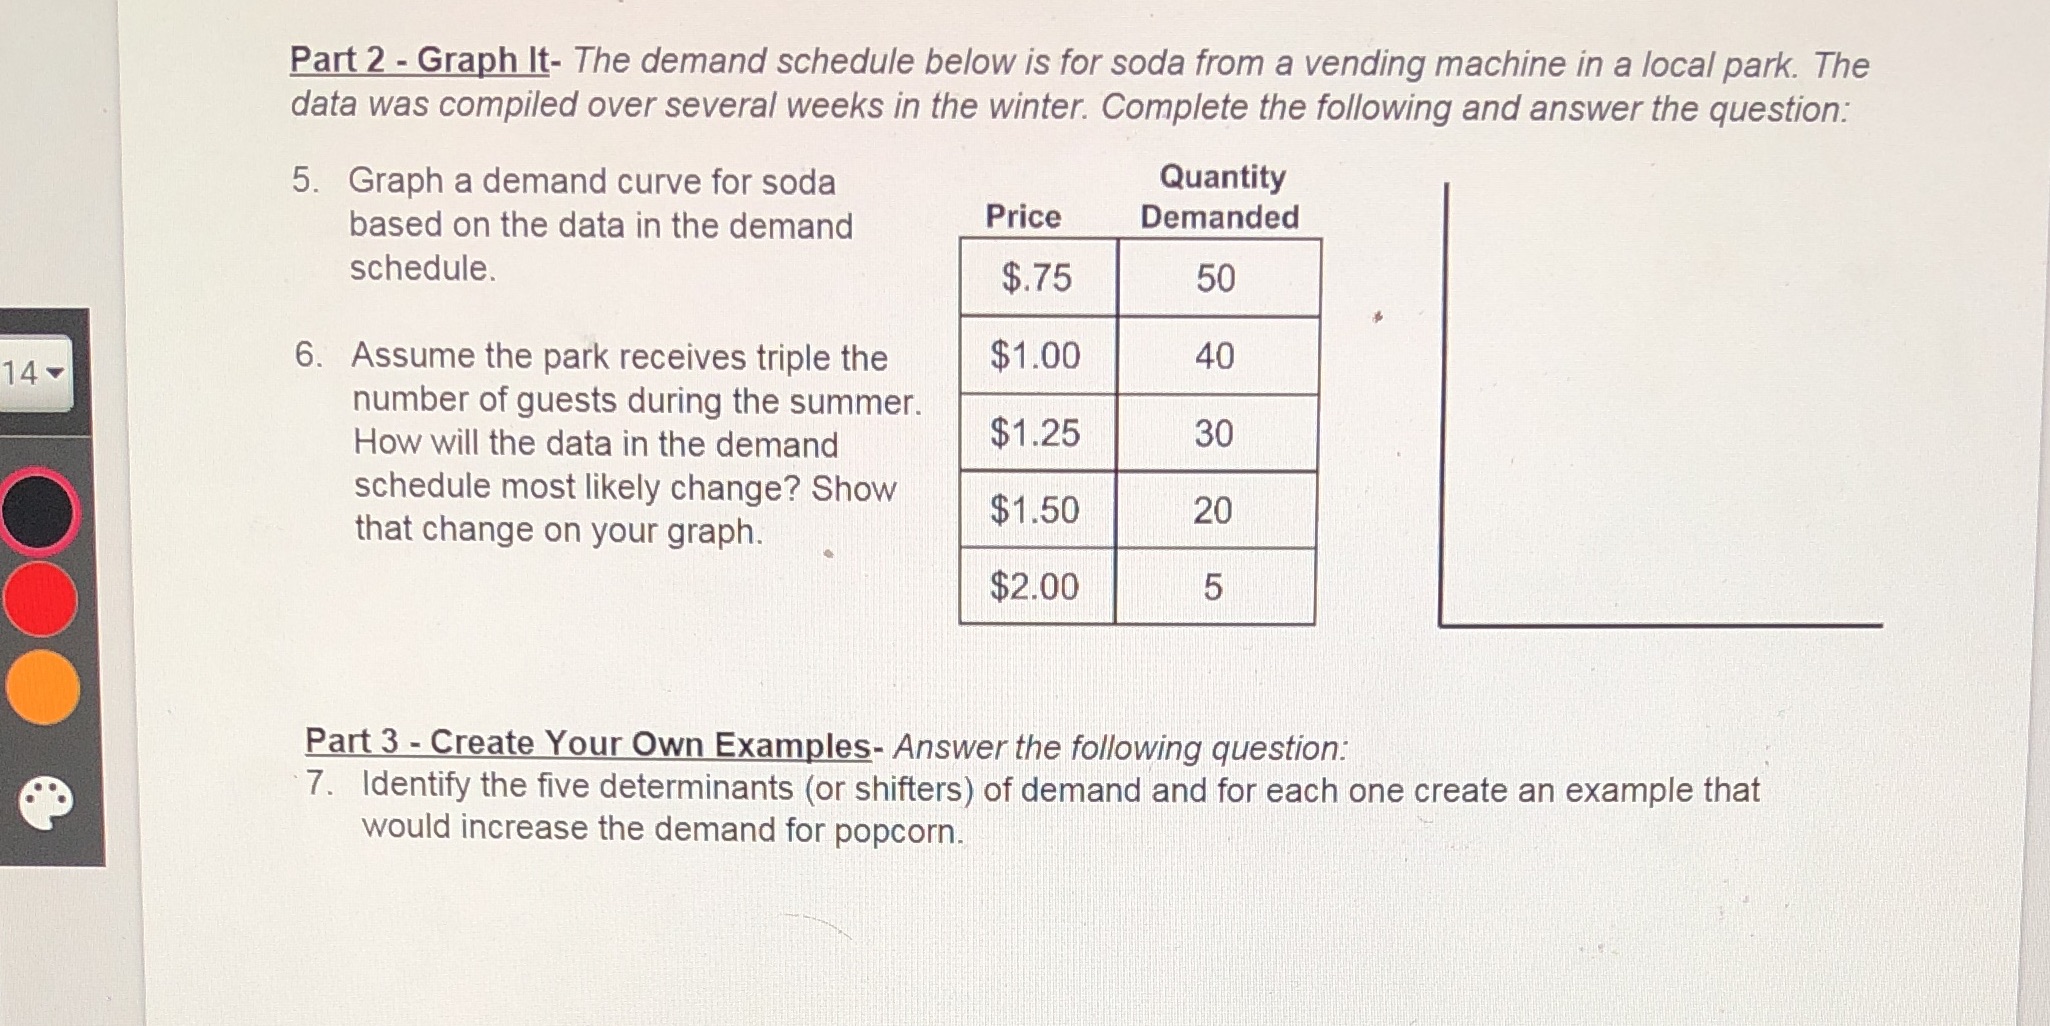

Part 2 - Graph It- The demand schedule below is for soda from a vending machine in a local park. The data was compiled over several weeks in the winter. Complete the following and answer the question: 5. Graph a demand curve for soda Quantity g based on the data in the demand Price Demanded 4. schedule. 6. Assume the park receives triple the 3 number of guests during the summer. How will the data in the demand schedule most likely change? Show that change on your graph. a Part 3- Create Your Own Examples- Answer the following question. ' 7. Identify the ve determinants (or shifters) of demand and for each one create an example that would' Increase the demand for popcorn
Step by Step Solution
There are 3 Steps involved in it

Get step-by-step solutions from verified subject matter experts