

Question: Part 2 Least Squares Regression for oceanographic data Create a MATLAB script that does what is outlined below. Save your MATLAB script as LinReg.m and
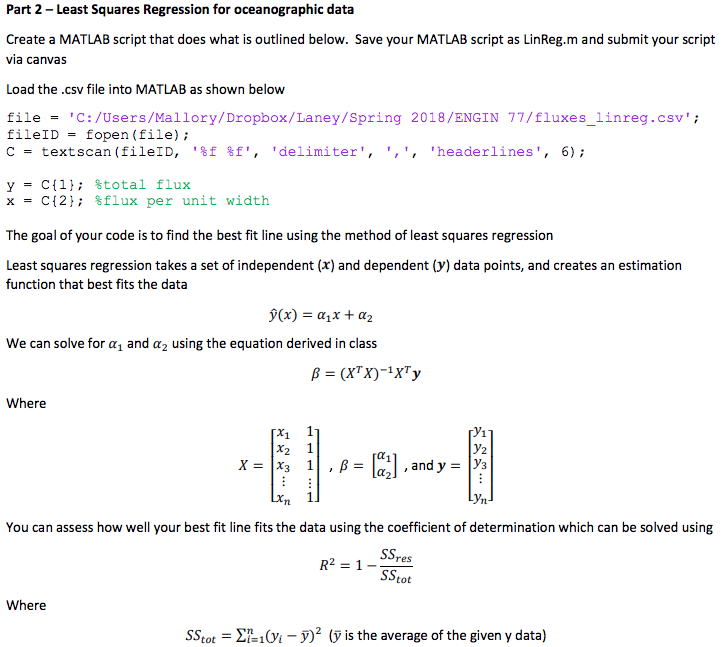
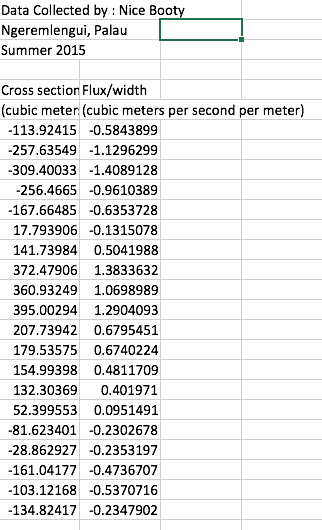
Part 2 Least Squares Regression for oceanographic data Create a MATLAB script that does what is outlined below. Save your MATLAB script as LinReg.m and submit your script via canvas Load the .csv file into MATLAB as shown below file-C:/Users/Mallory/Dropbox/Laney/Spring 2018/ENGIN 77/fluxes_linreg.csv fileID -fopen(file) C- textscan ( fileID, '%f %f', 'delimiter', ', ', 'headerlines', 6); y- x C(1); C(2); %total flux %flux per unit width The goal of your code is to find the best fit line using the method of least squares regression Least squares regression takes a set of independent (x) and dependent (y) data points, and creates an estimation function that best fits the data we can solve for ?1 and ?2 using the equation derived in class ? = (XT X)-1 XT y Where Vi y2 ?? yn ?11 I , andy 7L You can assess how well your best fit line fits the data using the coefficient of determination which can be solved using res tot Where SSto.-??'-1(yi-?2 (? is the average of the given y data) Part 2 Least Squares Regression for oceanographic data Create a MATLAB script that does what is outlined below. Save your MATLAB script as LinReg.m and submit your script via canvas Load the .csv file into MATLAB as shown below file-C:/Users/Mallory/Dropbox/Laney/Spring 2018/ENGIN 77/fluxes_linreg.csv fileID -fopen(file) C- textscan ( fileID, '%f %f', 'delimiter', ', ', 'headerlines', 6); y- x C(1); C(2); %total flux %flux per unit width The goal of your code is to find the best fit line using the method of least squares regression Least squares regression takes a set of independent (x) and dependent (y) data points, and creates an estimation function that best fits the data we can solve for ?1 and ?2 using the equation derived in class ? = (XT X)-1 XT y Where Vi y2 ?? yn ?11 I , andy 7L You can assess how well your best fit line fits the data using the coefficient of determination which can be solved using res tot Where SSto.-??'-1(yi-?2 (? is the average of the given y data)
Step by Step Solution
There are 3 Steps involved in it

Get step-by-step solutions from verified subject matter experts