

Question: Part 2. Linear Regression Sorting Data Filter data to only include students who are enrolled in the college you choose. Dummy code the Gender variable.
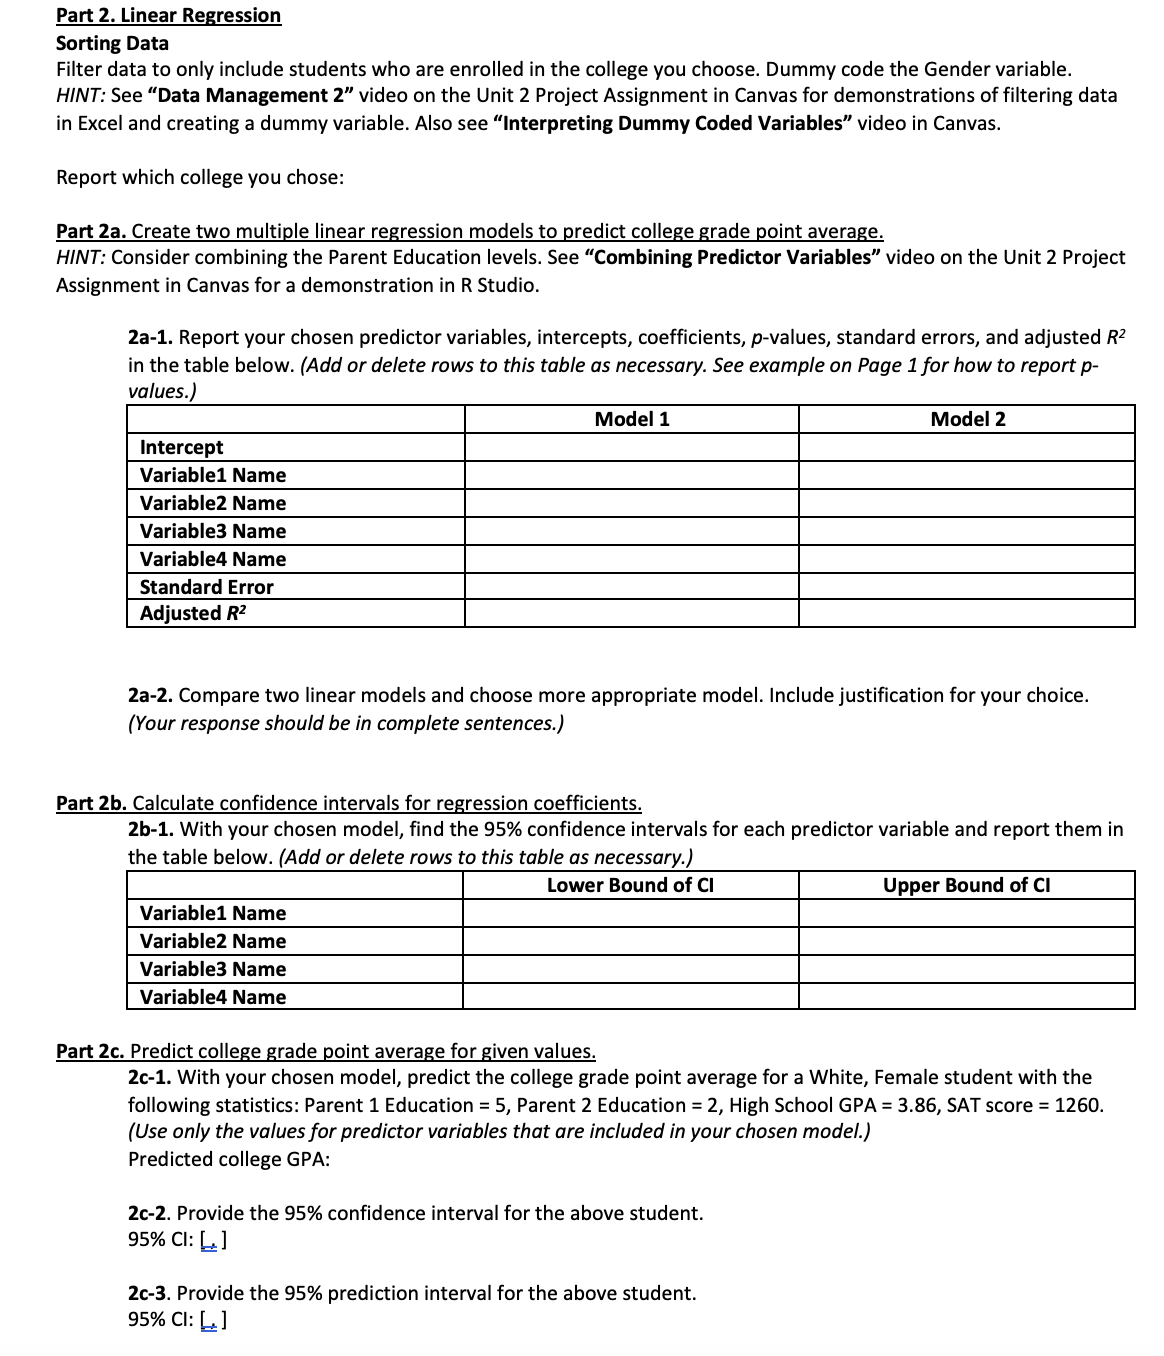
Part 2. Linear Regression Sorting Data Filter data to only include students who are enrolled in the college you choose. Dummy code the Gender variable. HINT: See \"Data Management 2\" video on the Unit 2 Project Assignment in Canvas for demonstrations of filtering data in Excel and creating a dummy variable. Also see \"Interpreting Dummy Coded Variables\" video in Canvas. Report which college you chose: Part 2a. Create two multiple linear regression models to predict college grade point average. HINT: Consider combining the Parent Education levels. See \"Combining Predictor Variables\" video on the Unit 2 Project Assignment in Canvas for a demonstration in R Studio. 2a-1. Report your chosen predictor variables, intercepts, coefficients, p-values, standard errors, and adjusted R? in the table below. (Add or delete rows to this table as necessary. See example on Page 1 for how to report p- values.) Variable1 Name 0000000 Variable2 Name 0000000 | Variable3Name | 000000 00 | variableaName | 0000000 0000000 | standardError [ 000000000000 | Adjustedrz [ 0000 000 2a-2. Compare two linear models and choose more appropriate model. Include justification for your choice. (Your response should be in complete sentences.) Part 2b. Calculate confidence intervals for regression coefficients. 2b-1. With your chosen model, find the 95% confidence intervals for each predictor variable and report them in the table below. (Add or delete rows to this table as necessary.) Lower Bound of Ci Upper Bound of CI Variable1 Name - ] Variable2 Name 000000 0 Variable3 Name 0 | Variable4 Name ] Part 2c. Predict college grade point average for given values. 2c-1. With your chosen model, predict the college grade point average for a White, Female student with the following statistics: Parent 1 Education = 5, Parent 2 Education = 2, High School GPA = 3.86, SAT score = 1260. (Use only the values for predictor variables that are included in your chosen model.) Predicted college GPA: 2c-2. Provide the 95% confidence interval for the above student. 95% Cl: [ ] 2c-3. Provide the 95% prediction interval for the above student. 95% Cl: [ ]
Step by Step Solution
There are 3 Steps involved in it

Get step-by-step solutions from verified subject matter experts