

Question: PART 2 NEEDS TO BE COMPLETED PART 1 HAS BEEN COMPLETED - SCREENSHOTS: In this part of your assignment, you will compose an analytical study
PART 2 NEEDS TO BE COMPLETED
PART 1 HAS BEEN COMPLETED - SCREENSHOTS:
In this part of your assignment, you will compose an analytical study reporting your results from Part 1. The CEO of your company is forming a task force to review the financials and present a review for acquisition of ABC Company. Based on ABCs previous 3 years of financials, determine if this would be a good acquisition. You must form the task force to complete the task. The CEO would like most of the departments to participate in the process. Using each departments area of expertise, what information would each of the following departments contribute to the final decision? Provide a minimum one-paragraph response for each department.
Finance Department
Sales Department
Marketing Department
Human Resources
Legal Department
Part 2 asks for minimum one paragraph for each department - this is what I need to have completed
Thank you!!
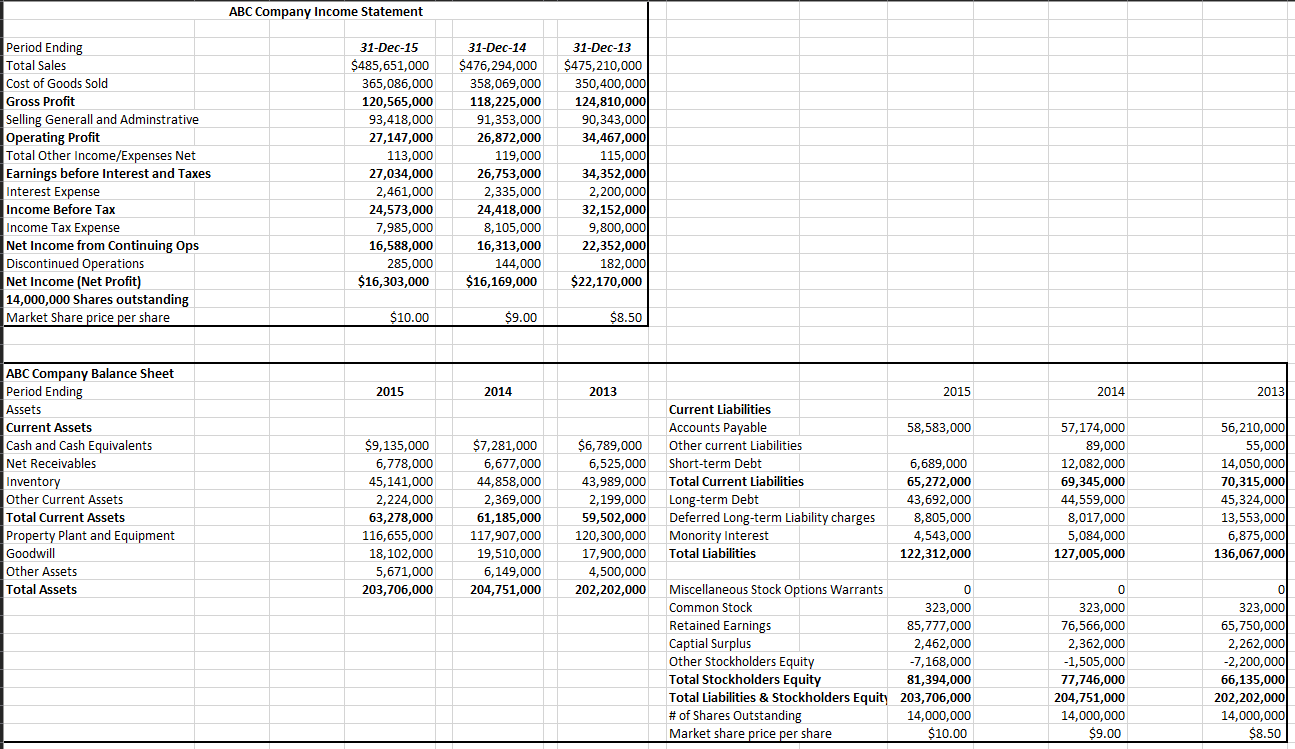
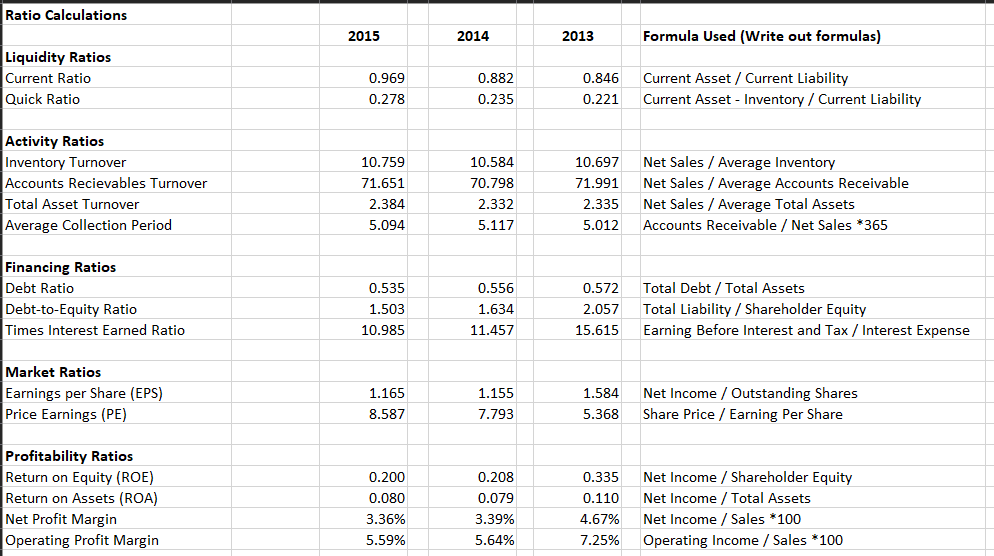
ABC Company Income Statement Period Ending Total Sales Cost of Goods Sold Gross Profit Selling Generall and Adminstrative Operating Profit Total Other Income/Expenses Net Earnings before Interest and Taxes Interest Expense Income Before Tax Income Tax Expense Net Income from Continuing Ops Discontinued Operations Net Income (Net Profit) 14,000,000 Shares outstanding Market Share price per share 31-Dec-15 $485,651,000 365,086,000 120,565,000 93,418,000 27,147,000 113,000 27,034,000 2,461,000 24,573,000 7,985,000 16,588,000 285,000 $16,303,000 31-Dec-14 $476,294,000 358,069,000 118,225,000 91,353,000 26,872,000 119,000 26,753,000 2,335,000 24,418,000 8,105,000 16,313,000 144,000 $16,169,000 31-Dec-13 $475,210,000 350,400,000 124,810,000 90,343,000 34,467,000 115,000 34,352,000 2,200,000 32,152,000 9,800,000 22,352,000 182,000 $22,170,000 $10.00 $9.00 $8.50 2015 2014 2013 2015 2014 2013 58,583,000 ABC Company Balance Sheet Period Ending Assets Current Assets Cash and Cash Equivalents Net Receivables Inventory Other Current Assets Total Current Assets Property Plant and Equipment Goodwill Other Assets Total Assets $9,135,000 6,778,000 45,141,000 2,224,000 63,278,000 116,655,000 18,102,000 5,671,000 203,706,000 $7,281,000 6,677,000 44,858,000 2,369,000 61,185,000 117,907,000 19,510,000 6,149,000 204,751,000 $6,789,000 6,525,000 43,989,000 2,199,000 59,502,000 120,300,000 17,900,000 4,500,000 202,202,000 Current Liabilities Accounts Payable Other current Liabilities Short-term Debt Total Current Liabilities Long-term Debt Deferred Long-term Liability charges Monority Interest Total Liabilities 6,689,000 65,272,000 43,692,000 8,805,000 4,543,000 122,312,000 57,174,000 89,000 12,082,000 69,345,000 44,559,000 8,017,000 5,084,000 127,005,000 56,210,000 55,000 14,050,000 70,315,000 45,324,000 13,553,000 6,875,000 136,067,000 Miscellaneous Stock Options Warrants 0 Common Stock 323,000 Retained Earnings 85,777,000 Captial Surplus 2,462,000 Other Stockholders Equity -7,168,000 Total Stockholders Equity 81,394,000 Total Liabilities & Stockholders Equity 203,706,000 # of Shares Outstanding 14,000,000 Market share price per share $10.00 0 323,000 76,566,000 2,362,000 -1,505,000 77,746,000 204,751,000 14,000,000 0 323,000 65,750,000 2,262,000 -2,200,000 66,135,000 202,202,000 14,000,000 $8.50 $ $9.00 Ratio Calculations 2015 2014 2013 Formula Used (Write out formulas) Liquidity Ratios Current Ratio Quick Ratio 0.969 0.278 0.882 0.235 0.846 0.221 Current Asset / Current Liability Current Asset - Inventory / Current Liability Activity Ratios Inventory Turnover Accounts Recievables Turnover Total Asset Turnover Average Collection Period 10.759 71.651 2.384 5.094 10.584 70.798 2.332 5.117 10.697 71.991 2.335 5.012 Net Sales / Average Inventory Net Sales / Average Accounts Receivable Net Sales / Average Total Assets Accounts Receivable / Net Sales *365 0.535 Financing Ratios Debt Ratio Debt-to-Equity Ratio Times Interest Earned Ratio 1.503 10.985 0.556 1.634 11.457 0.572 2.057 15.615 Total Debt / Total Assets Total Liability / Shareholder Equity Earning Before Interest and Tax / Interest Expense Market Ratios Earnings per Share (EPS) Price Earnings (PE) 1.165 8.587 1.155 7.793 1.584 5.368 Net Income / Outstanding Shares Share Price / Earning Per Share Profitability Ratios Return on Equity (ROE) Return on Assets (ROA) Net Profit Margin Operating Profit Margin 0.200 0.080 3.36% 5.59% 0.208 0.079 3.39% 5.64% 0.335 0.110 4.67% 7.25% Net Income / Shareholder Equity Net Income / Total Assets Net Income / Sales *100 Operating Income / Sales *100 ABC Company Income Statement Period Ending Total Sales Cost of Goods Sold Gross Profit Selling Generall and Adminstrative Operating Profit Total Other Income/Expenses Net Earnings before Interest and Taxes Interest Expense Income Before Tax Income Tax Expense Net Income from Continuing Ops Discontinued Operations Net Income (Net Profit) 14,000,000 Shares outstanding Market Share price per share 31-Dec-15 $485,651,000 365,086,000 120,565,000 93,418,000 27,147,000 113,000 27,034,000 2,461,000 24,573,000 7,985,000 16,588,000 285,000 $16,303,000 31-Dec-14 $476,294,000 358,069,000 118,225,000 91,353,000 26,872,000 119,000 26,753,000 2,335,000 24,418,000 8,105,000 16,313,000 144,000 $16,169,000 31-Dec-13 $475,210,000 350,400,000 124,810,000 90,343,000 34,467,000 115,000 34,352,000 2,200,000 32,152,000 9,800,000 22,352,000 182,000 $22,170,000 $10.00 $9.00 $8.50 2015 2014 2013 2015 2014 2013 58,583,000 ABC Company Balance Sheet Period Ending Assets Current Assets Cash and Cash Equivalents Net Receivables Inventory Other Current Assets Total Current Assets Property Plant and Equipment Goodwill Other Assets Total Assets $9,135,000 6,778,000 45,141,000 2,224,000 63,278,000 116,655,000 18,102,000 5,671,000 203,706,000 $7,281,000 6,677,000 44,858,000 2,369,000 61,185,000 117,907,000 19,510,000 6,149,000 204,751,000 $6,789,000 6,525,000 43,989,000 2,199,000 59,502,000 120,300,000 17,900,000 4,500,000 202,202,000 Current Liabilities Accounts Payable Other current Liabilities Short-term Debt Total Current Liabilities Long-term Debt Deferred Long-term Liability charges Monority Interest Total Liabilities 6,689,000 65,272,000 43,692,000 8,805,000 4,543,000 122,312,000 57,174,000 89,000 12,082,000 69,345,000 44,559,000 8,017,000 5,084,000 127,005,000 56,210,000 55,000 14,050,000 70,315,000 45,324,000 13,553,000 6,875,000 136,067,000 Miscellaneous Stock Options Warrants 0 Common Stock 323,000 Retained Earnings 85,777,000 Captial Surplus 2,462,000 Other Stockholders Equity -7,168,000 Total Stockholders Equity 81,394,000 Total Liabilities & Stockholders Equity 203,706,000 # of Shares Outstanding 14,000,000 Market share price per share $10.00 0 323,000 76,566,000 2,362,000 -1,505,000 77,746,000 204,751,000 14,000,000 0 323,000 65,750,000 2,262,000 -2,200,000 66,135,000 202,202,000 14,000,000 $8.50 $ $9.00 Ratio Calculations 2015 2014 2013 Formula Used (Write out formulas) Liquidity Ratios Current Ratio Quick Ratio 0.969 0.278 0.882 0.235 0.846 0.221 Current Asset / Current Liability Current Asset - Inventory / Current Liability Activity Ratios Inventory Turnover Accounts Recievables Turnover Total Asset Turnover Average Collection Period 10.759 71.651 2.384 5.094 10.584 70.798 2.332 5.117 10.697 71.991 2.335 5.012 Net Sales / Average Inventory Net Sales / Average Accounts Receivable Net Sales / Average Total Assets Accounts Receivable / Net Sales *365 0.535 Financing Ratios Debt Ratio Debt-to-Equity Ratio Times Interest Earned Ratio 1.503 10.985 0.556 1.634 11.457 0.572 2.057 15.615 Total Debt / Total Assets Total Liability / Shareholder Equity Earning Before Interest and Tax / Interest Expense Market Ratios Earnings per Share (EPS) Price Earnings (PE) 1.165 8.587 1.155 7.793 1.584 5.368 Net Income / Outstanding Shares Share Price / Earning Per Share Profitability Ratios Return on Equity (ROE) Return on Assets (ROA) Net Profit Margin Operating Profit Margin 0.200 0.080 3.36% 5.59% 0.208 0.079 3.39% 5.64% 0.335 0.110 4.67% 7.25% Net Income / Shareholder Equity Net Income / Total Assets Net Income / Sales *100 Operating Income / Sales *100
Step by Step Solution
There are 3 Steps involved in it

Get step-by-step solutions from verified subject matter experts