

Question: Part 2 Please The table below shows the expected rates of return for three stocks and their weights in some portfolio: Part 1 Attempt 1/5
Part 2 Please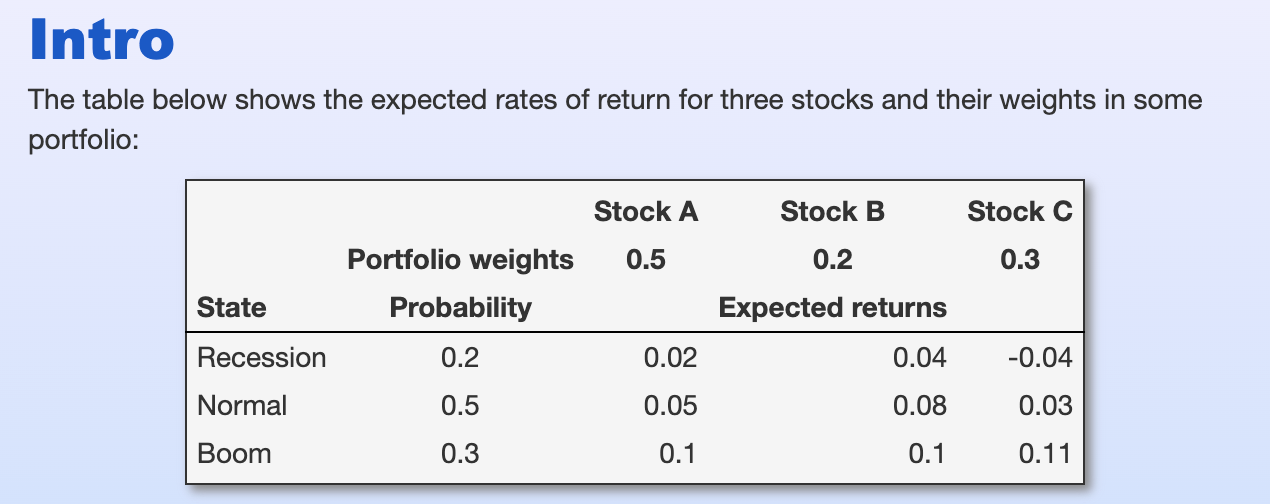
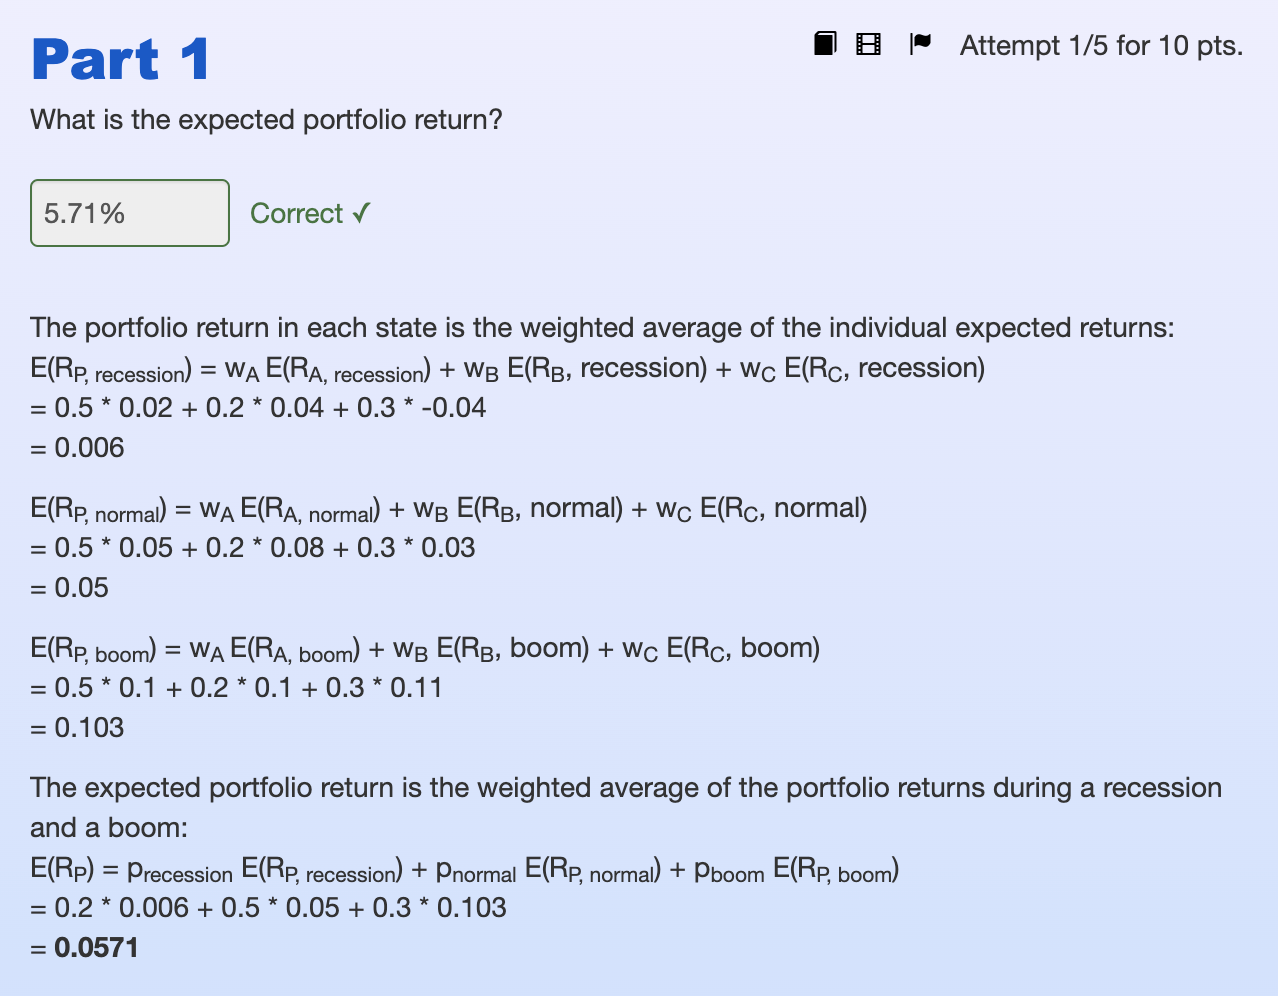
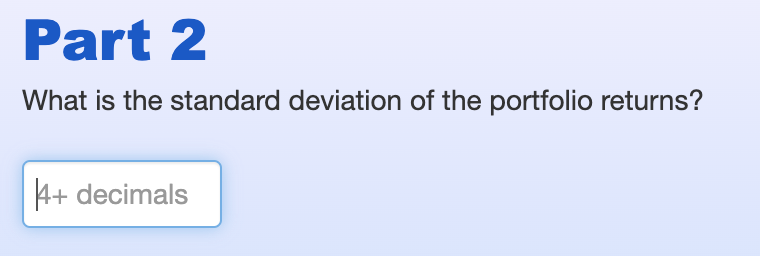
The table below shows the expected rates of return for three stocks and their weights in some portfolio: Part 1 Attempt 1/5 for 10 pts. What is the expected portfolio return? Correct The portfolio return in each state is the weighted average of the individual expected returns: E(RP,recession)=wAE(RA, recession )+wBE(RB, recession )+wCE(RC, recession ) =0.50.02+0.20.04+0.30.04=0.006 E(RP,normal)=wAE(RA,normal)+wBE(RB,normal)+wCE(RC,normal)=0.50.05+0.20.08+0.30.03=0.05 E(RP,boom)=wAE(RA,boom)+wBE(RB,boom)+wCE(RC,boom)=0.50.1+0.20.1+0.30.11=0.103 The expected portfolio return is the weighted average of the portfolio returns during a recession and a boom: E(RP)=precessionE(RP,recession)+pnormalE(RP,normal)+pboomE(RP,boom)=0.20.006+0.50.05+0.30.103=0.0571 What is the standard deviation of the portfolio returns
Step by Step Solution
There are 3 Steps involved in it

Get step-by-step solutions from verified subject matter experts