

Question: Part 2 - Rank stations by usage In this part of the lab, you will complete the rank _ station _ usage function. This function
Part Rank stations by usage
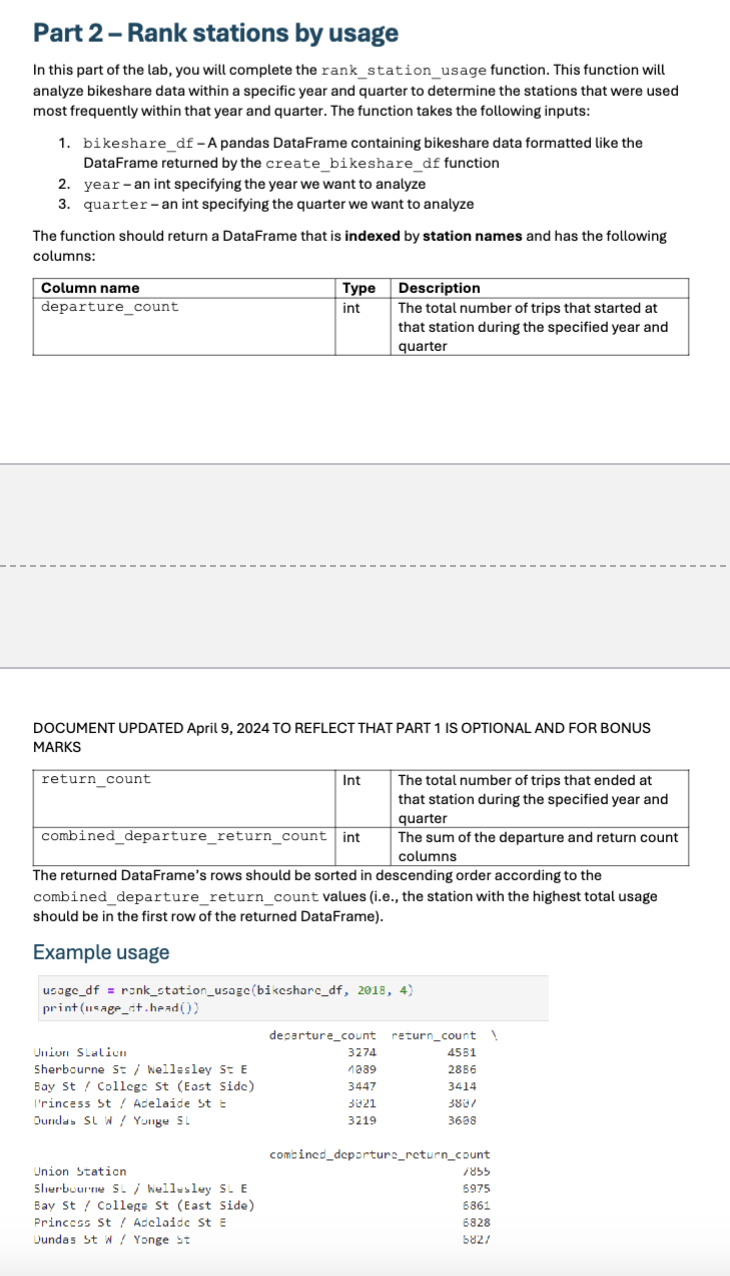
In this part of the lab, you will complete the rankstationusage function. This function will
analyze bikeshare data within a specific year and quarter to determine the stations that were used
most frequently within that year and quarter. The function takes the following inputs:
bikesharedf A pandas DataFrame containing bikeshare data formatted like the
DataFrame returned by the createbikesharedf function
year an int specifying the year we want to analyze
quarter an int specifying the quarter we want to analyze
The function should return a DataFrame that is indexed by station names and has the following
columns:
DOCUMENT UPDATED April TO REFLECT THAT PART IS OPTIONAL AND FOR BONUS
MARKS
The returned DataFrame's rows should be sorted in descending order according to the
combineddeparturereturncount values ie the station with the highest total usage
should be in the first row of the returned DataFrame
Example usage
Step by Step Solution
There are 3 Steps involved in it
1 Expert Approved Answer
Step: 1 Unlock

Question Has Been Solved by an Expert!
Get step-by-step solutions from verified subject matter experts
Step: 2 Unlock
Step: 3 Unlock