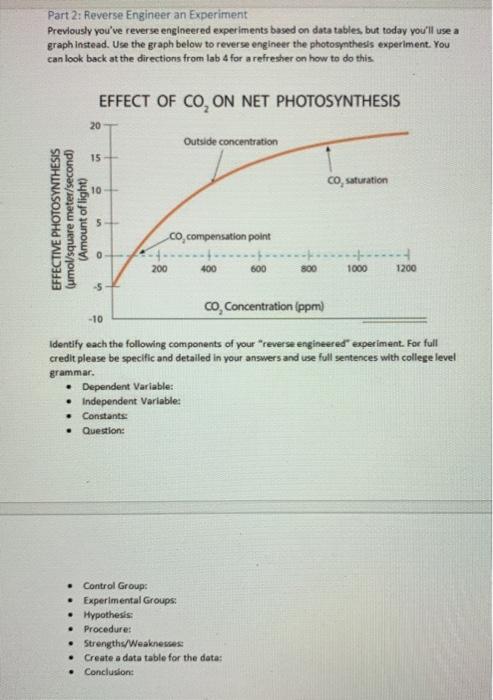
Question: Part 2: Reverse Engineer an Experiment Previously you've reverse engineered experiments based on data tables, but today you'll use a graph instead. Use the graph

Part 2: Reverse Engineer an Experiment Previously
Part 2: Reverse Engineer an Experiment Previously you've reverse engineered experiments based on data tables, but today you'll use a graph instead. Use the graph below to reverse engineer the photosynthesis experiment. You can look back at the directions from lab 4 for a refresher on how to do this EFFECT OF CO, ON NET PHOTOSYNTHESIS 20 Outside concentration 15 CO, saturation 10 EFFECTIVE PHOTOSYNTHESIS (umol/square meter/second) (Amount of light) 5 co compensation point 0 --------- 1000 1200 200 400 600 800 -5 Co Concentration (ppm) -10 Identify each the following components of your reverse engineered experiment. For full credit please be specific and detailed in your answers and use full sentences with college level grammar. Dependent Variable: Independent Variable: . Constants Question: . Control Group: Experimental Groups Hypothesis: Procedure: Strengths/Weaknesses Create a data table for the data: . Conclusion

Step by Step Solution

There are 3 Steps involved in it

1 Expert Approved Answer
Step: 1 Unlock blur-text-image
Question Has Been Solved by an Expert!

Get step-by-step solutions from verified subject matter experts

Step: 2 Unlock
Step: 3 Unlock

Students Have Also Explored These Related General Management Questions!