Question: Part 2. TABLE 2. PUNCTUALITY STATISTICS FOR FLIGHTS LEAVING HEATHROW AND LANDING IN CHINA (2019). % Early % Late 91 Destination City Airline 22 min
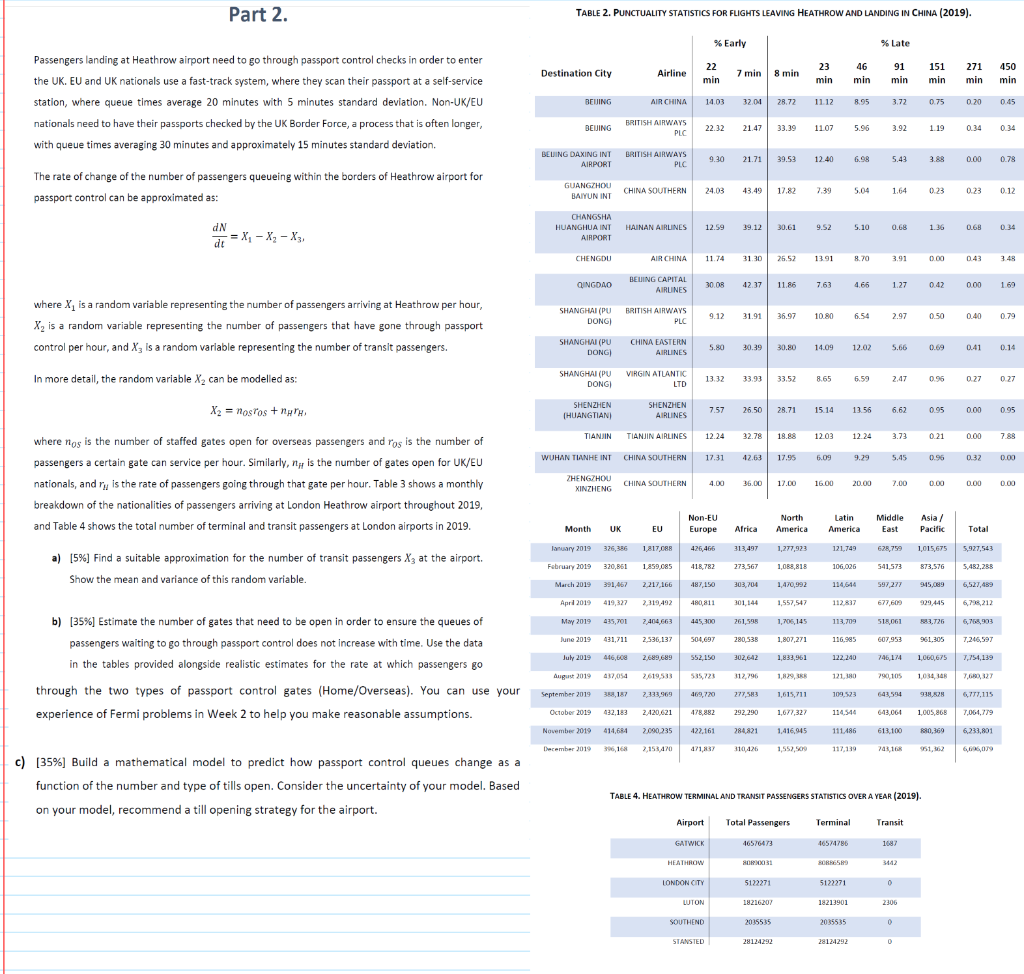
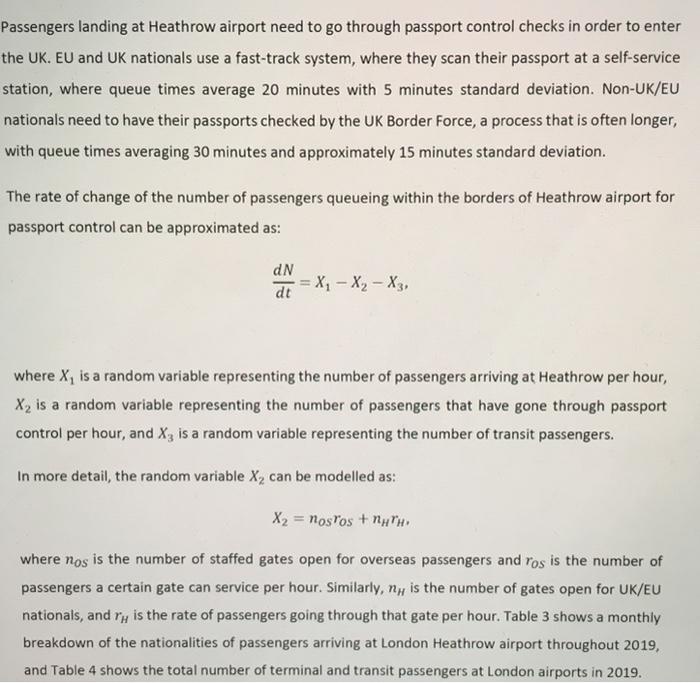
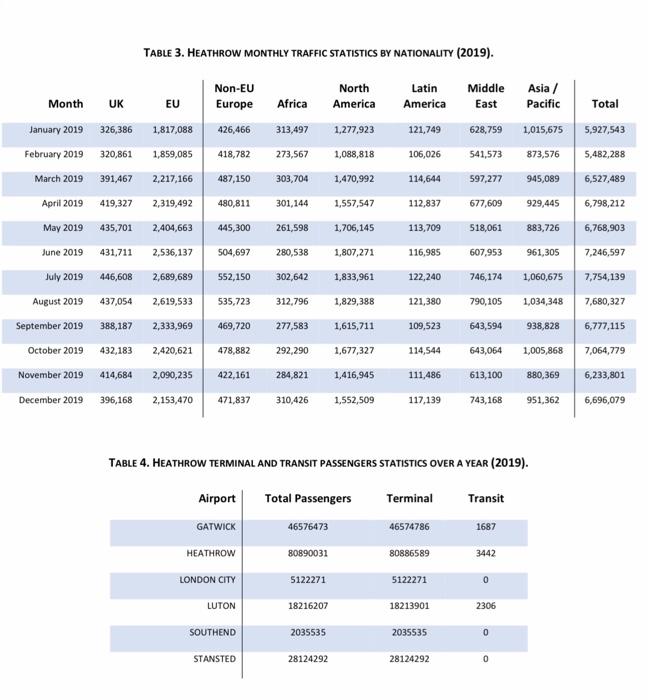
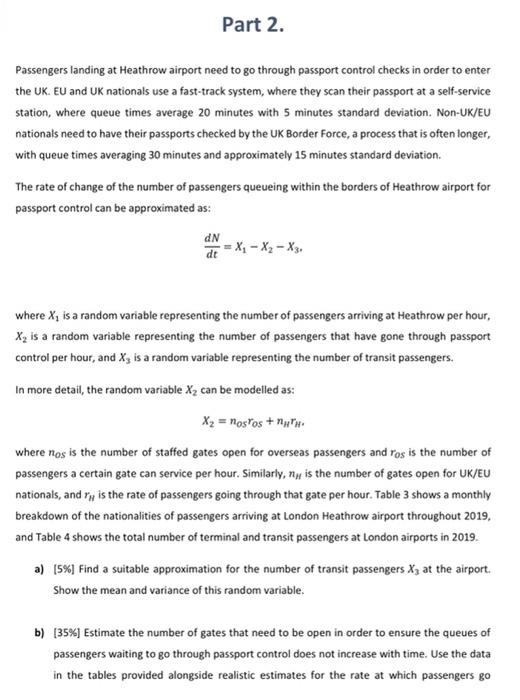
Part 2. TABLE 2. PUNCTUALITY STATISTICS FOR FLIGHTS LEAVING HEATHROW AND LANDING IN CHINA (2019). % Early % Late 91 Destination City Airline 22 min 7 min 8 min 23 min 46 min 151 min 271 min 450 min min Passengers landing at Heathrow airport need to go through passport control checks in order to enter the UK. EU and UK nationals use a fast-track system, where they scan their passport at a self-service station, where queue times average 20 minutes with 5 minutes standard deviation. Non-UK/EU nationals need to have their passports checked by the UK Border Force, a process that is often longer, with queue times averaging 30 minutes and approximately 15 minutes standard deviation. BEING AIR CHINA 14.03 32.01 28.72 1112 8.95 3.72 0.75 0.20 0.45 BEIJING BRITISH AIRWAYS PLC 22.32 21.47 33.39 1102 5.96 3.92 1.19 0.34 0.34 BEWING DAXING INT AIRPORT BRITISH AIRWAYS PLC 9.30 21.71 39.53 12.40 5.43 0.00 0.78 The rate of change of the number of passengers queueing within the borders of Heathrow airport for passport control can be approximated as: GUANGZHOU BAIYUN INT CHINA SOUTHERN 24.03 43.49 17.82 7.39 5.04 1.64 0.23 0.23 0.12 CHANGSHA HUANGHUA INT AIRPORT HAINAN AIRLINES 12.59 39.12 30.61 9.52 5.10 0.68 1.36 0.68 dN -= X - X, - X3 dt 0.34 CHENGDU AIR CHINA 11.74 31 30 25.52 1391 8.70 3.91 000 043 QINGDAO BELING CAPITAL AIRLINES 30.08 4237 11.86 763 4.66 1.27 0.42 000 1.69 SHANGHAI (PU DONG BRITISH AIRWAYS PLC 9.12 31.91 36.97 10.80 6.54 2.97 0.50 0.41 0.79 where X, is a random variable representing the number of passengers arriving at Heathrow per hour, X, is a random variable representing the number of passengers that have gone through passport control per hour, and X3 is a random variable representing the number of transit passengers. , SHANGHAI (PU DONG CHINA EASTERN AIRLINES 5.80 30.39 30.80 14.09 12.02 5.66 0.69 0.41 0.14 In more detail, the random variable X, can be modelled as: SHANGHAI (PU DONG VIRGIN ATLANTIC LTD 13.32 33.93 33.52 8.65 6.59 2.47 0.96 0.27 0.27 X2 = nostos + nur SHENZHEN (HUANGTIANI SHENZHEN AIRLINES 7.57 26.50 28.71 15.14 13.56 6.62 0.95 0.00 0.95 TIANJIN TIANJIN AIRLINES 12.24 32.78 18.88 12.03 12.24 3.73 0.21 0.00 789 WUHAN TIANHE INT CHINA SOUTHERN 17.31 42.63 17.95 5.09 9.29 5.45 0.32 0.00 where nos is the number of staffed gates open for overseas passengers and ros is the number of passengers a certain gate can service per hour. Similarly, ng is the number of gates open for UK/EU nationals, and ry is the rate of passengers going through that gate per hour. Table 3 shows a monthly breakdown of the nationalities of passengers arriving at London Heathrow airport throughout 2019, and Table 4 shows the total number of terminal and transit passengers at London airports in 2019. ZHENGZHOU XINZHENG CHINA SOUTHERN 4.00 36.00 17.00 16.00 20.00 2.00 0.00 0.00 0.00 Non-EU Europe Month North America Middle East UK Latin America Asia/ Pacific EU Africa Total January 2019 326,386 1817.0RB 426,466 313,497 1,277,923 121,749 62,79 1,025,675 5,927,543 a) [5%] Find a suitable approximation for the number of transit passengers X3 at the airport. Show the mean and variance of this random variable. 1459.085 418,782 273,567 106.026 541573 873.576 5,482,283 February 2019 320,851 March 2019 91,467 391,467 1,088,818 1,470,992 2.217 166 487,150 303,704 114,644 597,277 915,089 6,527,489 April 2019 419,327 2,319492 480,811 301,144 1,557,547 112.17 929.445 6,738,212 May 2012 435,701 2,404,663 445,300 261,598 1,706,145 113.709 515,061 583.726 6,765, 903 June 2010 431,711 2,536,137 504,697 280,538 1,807,271 116.995 607 953 961,305 7,246,597 July 2019 446,608 2,689,689 552,150 302.642 1,833,961 122.240 746,174 1,060,675 7,754,139 b) [35%] Estimate the number of gates that need to be open in order to ensure the queues of passengers waiting to go through passport control does not increase with time. Use the data in the tables provided alongside realistic estimates for the rate at which passengers go through the two types of passport control gates (Home/Overseas). You can use your experience of Fermi problems in Week 2 to help you make reasonable assumptions. August 2019 437,054 2619,533 S# 312,796 1,829, 121,380 790,105 10341 7,622,127 2,333,969 469,720 27753 1.615.711 109,523 643594 93.2 6,771,115 September 2019 388, 187 October 2019 432,183 2420,621 478,82 292, 290 1,677,327 114546 643.064 1,005,868 7,064,779 November 2010 414,684 2,090.235 -122.161 284.821 1.416,945 111.486 613,100 180,369 6,233,801 December 2019 396,168 2,153 470 471,837 310426 1,557,500 117,119 743166 c) (35%] Build a mathematical model to predict how passport control queues change as a function of the number and type of tills open. Consider the uncertainty of your model. Based on your model, recommend a till opening strategy for the airport. TABLE 4. HEATHROW TERMINAL AND TRANSIT PASSENGERS STATISTICS OVER A YEAR (2019). Airport Total Passengers Terminal Transit GATWICK 16576473 46574786 1687 HEATHROW ORXX 50 3442 LONDON CITY 5122271 5122271 0 LUTON 18216201 18213901 2306 SOUTHEND 2035535 2035535 O STANSTED 20124292 28124292 0 Passengers landing at Heathrow airport need to go through passport control checks in order to enter the UK. EU and UK nationals use a fast-track system, where they scan their passport at a self-service station, where queue times average 20 minutes with 5 minutes standard deviation. Non-UK/EU nationals need to have their passports checked by the UK Border Force, a process that is often longer, with queue times averaging 30 minutes and approximately 15 minutes standard deviation. The rate of change of the number of passengers queueing within the borders of Heathrow airport for passport control can be approximated as: dN dt = X; - Xy - X3 where X, is a random variable representing the number of passengers arriving at Heathrow per hour, X, is a random variable representing the number of passengers that have gone through passport control per hour, and X, is a random variable representing the number of transit passengers. In more detail, the random variable X, can be modelled as: X2 = nosos + n ) where nos is the number of staffed gates open for overseas passengers and ros is the number of passengers a certain gate can service per hour. Similarly, ny is the number of gates open for UK/EU nationals, and r, is the rate of passengers going through that gate per hour. Table 3 shows a monthly breakdown of the nationalities of passengers arriving at London Heathrow airport throughout 2019, and Table 4 shows the total number of terminal and transit passengers at London airports in 2019. TABLE 3. HEATHROW MONTHLY TRAFFIC STATISTICS BY NATIONALITY (2019). Non-EU Europe EU North America Africa Middle East UK Asia/ Pacific Total 326,386 1,817,088 426,466 313,497 1,277,923 Latin America 121,749 106,026 114,644 628,759 1,015,675 Month January 2019 February 2019 March 2019 5,927,543 320,861 1,859,085 418,782 273,567 1,088,818 541,573 873,576 5,482,288 391,467 2,217,166 487,150 303,704 1,470,992 597,277 945,089 6,527,489 April 2019 419,327 2,319,492 480,811 301,144 1,557,547 112,837 677,609 929,445 6,798,212 May 2019 435,701 2,404,663 445,300 261,598 1,706,145 113,709 518,061 883,726 6,768,903 June 2019 431,711 2,536,137 504,697 280,538 1,807,271 116,985 607,953 961,305 7,246,597 July 2019 446,608 2,689,689 552,150 302,642 1,833,961 122,240 746,174 1,060,675 7,754,139 August 2019 437,054 2,619,533 535,723 312,796 1,829,388 121,380 790,105 1,034,348 7,680,327 388,187 2,333,969 277,583 1,615,711 109,523 643,594 938,828 6,777,115 469,720 478,882 432,183 2,420,621 292,290 1,677,327 114,544 643,064 1,005,868 7,064,779 September 2019 October 2019 November 2019 December 2019 414,684 2,090,235 422,161 284,821 1,416,945 111.486 613,100 880,369 6,233,801 396,168 2,153,470 471,837 310,426 1,552,509 117,139 743,168 951,362 6,696,079 TABLE 4. HEATHROW TERMINAL AND TRANSIT PASSENGERS STATISTICS OVER A YEAR (2019). Total Passengers Terminal Transit Airport GATWICK 46576473 46574786 1687 HEATHROW 80890031 80886589 3442 LONDON CITY 5122271 5122271 0 LUTON 18216207 18213901 2306 SOUTHEND 2035535 2035535 0 STANSTED 28124292 28124292 0 TABLE 2. PUNCTUALITY STATISTICS FOR FLIGHTS LEAVING HEATHROW AND LANDING IN CHINA (2019). % Early % Late 22 Destination City Airline 23 min 7 min 8 min 46 min 151 91 min 271 min 450 min min min BEUING AIR CHINA 14.03 32.04 28.72 11.12 8.95 3.72 0.75 0.20 0.45 BEUING BRITISH AIRWAYS 22.32 21.47 33.39 11.07 5.96 3.92 1.19 0.34 PLC 0.34 BEIJING DAXING INT AIRPORT BRITISH AIRWAYS PLC 9.30 21.71 39.53 12.40 6.98 5.43 3.88 0.00 0.78 GUANGZHOU BAIYUN INT CHINA SOUTHERN 24.03 43.49 17.82 7.39 5.04 1.64 0.23 0.23 0.12 12.59 39.12 30.61 9.52 5.10 0.68 1.36 0.68 0.34 11.74 31.30 26.52 13.91 8.70 3.91 0.00 0.43 3.48 30.08 42.37 11.86 7.63 4.66 1.27 0.42 0.00 1.69 9.12 31.91 36.97 10.80 6.54 2.97 0.50 0.40 0.79 5.80 30.39 30.80 14.09 12.02 5.66 0.69 0.41 0.14 CHANGSHA HUANGHUAINT HAINAN AIRLINES AIRPORT CHENGDU AIR CHINA QINGDAO BEUING CAPITAL AIRLINES SHANGHAI (PU BRITISH AIRWAYS DONG) PLC SHANGHAI (PU CHINA EASTERN DONG) AIRLINES SHANGHAI (PU VIRGIN ATLANTIC DONG) LTD SHENZHEN SHENZHEN (HUANGTIAN) AIRLINES TIANJIN TIANJIN AIRLINES WUHAN TIANHE INT CHINA SOUTHERN ZHENGZHOU XINZHENG CHINA SOUTHERN 13.32 33.93 33.52 8.65 6.59 2.47 0.96 0.27 0.27 7.57 26.50 28.71 15.14 13.56 6.62 0.95 0.00 0.95 12.24 32.78 18.88 12.03 12.24 3.73 0.21 0.00 7.88 17.31 42.63 17.95 6.09 9.29 5.45 0.96 0.32 0.00 4.00 36.00 17.00 16.00 20.00 7.00 0.00 0.00 0.00 Part 2 Passengers landing at Heathrow airport need to go through passport control checks in order to enter the UK. EU and UK nationals use a fast-track system, where they scan their passport at a self-service station, where queue times average 20 minutes with 5 minutes standard deviation. Non-UK/EU nationals need to have their passports checked by the UK Border Force, a process that is often longer, with queue times averaging 30 minutes and approximately 15 minutes standard deviation. The rate of change of the number of passengers queueing within the borders of Heathrow airport for passport control can be approximated as: dN dt = X - X2 - X3 where X, is a random variable representing the number of passengers arriving at Heathrow per hour, X, is a random variable representing the number of passengers that have gone through passport control per hour, and X3 is a random variable representing the number of transit passengers. In more detail, the random variable X, can be modelled as: X, = nosos + n where nos is the number of staffed gates open for overseas passengers and ros is the number of passengers a certain gate can service per hour. Similarly, nem is the number of gates open for UK/EU nationals, and ry is the rate of passengers going through that gate per hour. Table 3 shows a monthly breakdown of the nationalities of passengers arriving at London Heathrow airport throughout 2019, and Table 4 shows the total number of terminal and transit passengers at London airports in 2019. a) 15%] Find a suitable approximation for the number of transit passengers X; at the airport. Show the mean and variance of this random variable. b) (35%] Estimate the number of gates that need to be open in order to ensure the queues of passengers waiting to go through passport control does not increase with time. Use the data in the tables provided alongside realistic estimates for the rate at which passengers go Part 2. TABLE 2. PUNCTUALITY STATISTICS FOR FLIGHTS LEAVING HEATHROW AND LANDING IN CHINA (2019). % Early % Late 91 Destination City Airline 22 min 7 min 8 min 23 min 46 min 151 min 271 min 450 min min Passengers landing at Heathrow airport need to go through passport control checks in order to enter the UK. EU and UK nationals use a fast-track system, where they scan their passport at a self-service station, where queue times average 20 minutes with 5 minutes standard deviation. Non-UK/EU nationals need to have their passports checked by the UK Border Force, a process that is often longer, with queue times averaging 30 minutes and approximately 15 minutes standard deviation. BEING AIR CHINA 14.03 32.01 28.72 1112 8.95 3.72 0.75 0.20 0.45 BEIJING BRITISH AIRWAYS PLC 22.32 21.47 33.39 1102 5.96 3.92 1.19 0.34 0.34 BEWING DAXING INT AIRPORT BRITISH AIRWAYS PLC 9.30 21.71 39.53 12.40 5.43 0.00 0.78 The rate of change of the number of passengers queueing within the borders of Heathrow airport for passport control can be approximated as: GUANGZHOU BAIYUN INT CHINA SOUTHERN 24.03 43.49 17.82 7.39 5.04 1.64 0.23 0.23 0.12 CHANGSHA HUANGHUA INT AIRPORT HAINAN AIRLINES 12.59 39.12 30.61 9.52 5.10 0.68 1.36 0.68 dN -= X - X, - X3 dt 0.34 CHENGDU AIR CHINA 11.74 31 30 25.52 1391 8.70 3.91 000 043 QINGDAO BELING CAPITAL AIRLINES 30.08 4237 11.86 763 4.66 1.27 0.42 000 1.69 SHANGHAI (PU DONG BRITISH AIRWAYS PLC 9.12 31.91 36.97 10.80 6.54 2.97 0.50 0.41 0.79 where X, is a random variable representing the number of passengers arriving at Heathrow per hour, X, is a random variable representing the number of passengers that have gone through passport control per hour, and X3 is a random variable representing the number of transit passengers. , SHANGHAI (PU DONG CHINA EASTERN AIRLINES 5.80 30.39 30.80 14.09 12.02 5.66 0.69 0.41 0.14 In more detail, the random variable X, can be modelled as: SHANGHAI (PU DONG VIRGIN ATLANTIC LTD 13.32 33.93 33.52 8.65 6.59 2.47 0.96 0.27 0.27 X2 = nostos + nur SHENZHEN (HUANGTIANI SHENZHEN AIRLINES 7.57 26.50 28.71 15.14 13.56 6.62 0.95 0.00 0.95 TIANJIN TIANJIN AIRLINES 12.24 32.78 18.88 12.03 12.24 3.73 0.21 0.00 789 WUHAN TIANHE INT CHINA SOUTHERN 17.31 42.63 17.95 5.09 9.29 5.45 0.32 0.00 where nos is the number of staffed gates open for overseas passengers and ros is the number of passengers a certain gate can service per hour. Similarly, ng is the number of gates open for UK/EU nationals, and ry is the rate of passengers going through that gate per hour. Table 3 shows a monthly breakdown of the nationalities of passengers arriving at London Heathrow airport throughout 2019, and Table 4 shows the total number of terminal and transit passengers at London airports in 2019. ZHENGZHOU XINZHENG CHINA SOUTHERN 4.00 36.00 17.00 16.00 20.00 2.00 0.00 0.00 0.00 Non-EU Europe Month North America Middle East UK Latin America Asia/ Pacific EU Africa Total January 2019 326,386 1817.0RB 426,466 313,497 1,277,923 121,749 62,79 1,025,675 5,927,543 a) [5%] Find a suitable approximation for the number of transit passengers X3 at the airport. Show the mean and variance of this random variable. 1459.085 418,782 273,567 106.026 541573 873.576 5,482,283 February 2019 320,851 March 2019 91,467 391,467 1,088,818 1,470,992 2.217 166 487,150 303,704 114,644 597,277 915,089 6,527,489 April 2019 419,327 2,319492 480,811 301,144 1,557,547 112.17 929.445 6,738,212 May 2012 435,701 2,404,663 445,300 261,598 1,706,145 113.709 515,061 583.726 6,765, 903 June 2010 431,711 2,536,137 504,697 280,538 1,807,271 116.995 607 953 961,305 7,246,597 July 2019 446,608 2,689,689 552,150 302.642 1,833,961 122.240 746,174 1,060,675 7,754,139 b) [35%] Estimate the number of gates that need to be open in order to ensure the queues of passengers waiting to go through passport control does not increase with time. Use the data in the tables provided alongside realistic estimates for the rate at which passengers go through the two types of passport control gates (Home/Overseas). You can use your experience of Fermi problems in Week 2 to help you make reasonable assumptions. August 2019 437,054 2619,533 S# 312,796 1,829, 121,380 790,105 10341 7,622,127 2,333,969 469,720 27753 1.615.711 109,523 643594 93.2 6,771,115 September 2019 388, 187 October 2019 432,183 2420,621 478,82 292, 290 1,677,327 114546 643.064 1,005,868 7,064,779 November 2010 414,684 2,090.235 -122.161 284.821 1.416,945 111.486 613,100 180,369 6,233,801 December 2019 396,168 2,153 470 471,837 310426 1,557,500 117,119 743166 c) (35%] Build a mathematical model to predict how passport control queues change as a function of the number and type of tills open. Consider the uncertainty of your model. Based on your model, recommend a till opening strategy for the airport. TABLE 4. HEATHROW TERMINAL AND TRANSIT PASSENGERS STATISTICS OVER A YEAR (2019). Airport Total Passengers Terminal Transit GATWICK 16576473 46574786 1687 HEATHROW ORXX 50 3442 LONDON CITY 5122271 5122271 0 LUTON 18216201 18213901 2306 SOUTHEND 2035535 2035535 O STANSTED 20124292 28124292 0 Passengers landing at Heathrow airport need to go through passport control checks in order to enter the UK. EU and UK nationals use a fast-track system, where they scan their passport at a self-service station, where queue times average 20 minutes with 5 minutes standard deviation. Non-UK/EU nationals need to have their passports checked by the UK Border Force, a process that is often longer, with queue times averaging 30 minutes and approximately 15 minutes standard deviation. The rate of change of the number of passengers queueing within the borders of Heathrow airport for passport control can be approximated as: dN dt = X; - Xy - X3 where X, is a random variable representing the number of passengers arriving at Heathrow per hour, X, is a random variable representing the number of passengers that have gone through passport control per hour, and X, is a random variable representing the number of transit passengers. In more detail, the random variable X, can be modelled as: X2 = nosos + n ) where nos is the number of staffed gates open for overseas passengers and ros is the number of passengers a certain gate can service per hour. Similarly, ny is the number of gates open for UK/EU nationals, and r, is the rate of passengers going through that gate per hour. Table 3 shows a monthly breakdown of the nationalities of passengers arriving at London Heathrow airport throughout 2019, and Table 4 shows the total number of terminal and transit passengers at London airports in 2019. TABLE 3. HEATHROW MONTHLY TRAFFIC STATISTICS BY NATIONALITY (2019). Non-EU Europe EU North America Africa Middle East UK Asia/ Pacific Total 326,386 1,817,088 426,466 313,497 1,277,923 Latin America 121,749 106,026 114,644 628,759 1,015,675 Month January 2019 February 2019 March 2019 5,927,543 320,861 1,859,085 418,782 273,567 1,088,818 541,573 873,576 5,482,288 391,467 2,217,166 487,150 303,704 1,470,992 597,277 945,089 6,527,489 April 2019 419,327 2,319,492 480,811 301,144 1,557,547 112,837 677,609 929,445 6,798,212 May 2019 435,701 2,404,663 445,300 261,598 1,706,145 113,709 518,061 883,726 6,768,903 June 2019 431,711 2,536,137 504,697 280,538 1,807,271 116,985 607,953 961,305 7,246,597 July 2019 446,608 2,689,689 552,150 302,642 1,833,961 122,240 746,174 1,060,675 7,754,139 August 2019 437,054 2,619,533 535,723 312,796 1,829,388 121,380 790,105 1,034,348 7,680,327 388,187 2,333,969 277,583 1,615,711 109,523 643,594 938,828 6,777,115 469,720 478,882 432,183 2,420,621 292,290 1,677,327 114,544 643,064 1,005,868 7,064,779 September 2019 October 2019 November 2019 December 2019 414,684 2,090,235 422,161 284,821 1,416,945 111.486 613,100 880,369 6,233,801 396,168 2,153,470 471,837 310,426 1,552,509 117,139 743,168 951,362 6,696,079 TABLE 4. HEATHROW TERMINAL AND TRANSIT PASSENGERS STATISTICS OVER A YEAR (2019). Total Passengers Terminal Transit Airport GATWICK 46576473 46574786 1687 HEATHROW 80890031 80886589 3442 LONDON CITY 5122271 5122271 0 LUTON 18216207 18213901 2306 SOUTHEND 2035535 2035535 0 STANSTED 28124292 28124292 0 TABLE 2. PUNCTUALITY STATISTICS FOR FLIGHTS LEAVING HEATHROW AND LANDING IN CHINA (2019). % Early % Late 22 Destination City Airline 23 min 7 min 8 min 46 min 151 91 min 271 min 450 min min min BEUING AIR CHINA 14.03 32.04 28.72 11.12 8.95 3.72 0.75 0.20 0.45 BEUING BRITISH AIRWAYS 22.32 21.47 33.39 11.07 5.96 3.92 1.19 0.34 PLC 0.34 BEIJING DAXING INT AIRPORT BRITISH AIRWAYS PLC 9.30 21.71 39.53 12.40 6.98 5.43 3.88 0.00 0.78 GUANGZHOU BAIYUN INT CHINA SOUTHERN 24.03 43.49 17.82 7.39 5.04 1.64 0.23 0.23 0.12 12.59 39.12 30.61 9.52 5.10 0.68 1.36 0.68 0.34 11.74 31.30 26.52 13.91 8.70 3.91 0.00 0.43 3.48 30.08 42.37 11.86 7.63 4.66 1.27 0.42 0.00 1.69 9.12 31.91 36.97 10.80 6.54 2.97 0.50 0.40 0.79 5.80 30.39 30.80 14.09 12.02 5.66 0.69 0.41 0.14 CHANGSHA HUANGHUAINT HAINAN AIRLINES AIRPORT CHENGDU AIR CHINA QINGDAO BEUING CAPITAL AIRLINES SHANGHAI (PU BRITISH AIRWAYS DONG) PLC SHANGHAI (PU CHINA EASTERN DONG) AIRLINES SHANGHAI (PU VIRGIN ATLANTIC DONG) LTD SHENZHEN SHENZHEN (HUANGTIAN) AIRLINES TIANJIN TIANJIN AIRLINES WUHAN TIANHE INT CHINA SOUTHERN ZHENGZHOU XINZHENG CHINA SOUTHERN 13.32 33.93 33.52 8.65 6.59 2.47 0.96 0.27 0.27 7.57 26.50 28.71 15.14 13.56 6.62 0.95 0.00 0.95 12.24 32.78 18.88 12.03 12.24 3.73 0.21 0.00 7.88 17.31 42.63 17.95 6.09 9.29 5.45 0.96 0.32 0.00 4.00 36.00 17.00 16.00 20.00 7.00 0.00 0.00 0.00 Part 2 Passengers landing at Heathrow airport need to go through passport control checks in order to enter the UK. EU and UK nationals use a fast-track system, where they scan their passport at a self-service station, where queue times average 20 minutes with 5 minutes standard deviation. Non-UK/EU nationals need to have their passports checked by the UK Border Force, a process that is often longer, with queue times averaging 30 minutes and approximately 15 minutes standard deviation. The rate of change of the number of passengers queueing within the borders of Heathrow airport for passport control can be approximated as: dN dt = X - X2 - X3 where X, is a random variable representing the number of passengers arriving at Heathrow per hour, X, is a random variable representing the number of passengers that have gone through passport control per hour, and X3 is a random variable representing the number of transit passengers. In more detail, the random variable X, can be modelled as: X, = nosos + n where nos is the number of staffed gates open for overseas passengers and ros is the number of passengers a certain gate can service per hour. Similarly, nem is the number of gates open for UK/EU nationals, and ry is the rate of passengers going through that gate per hour. Table 3 shows a monthly breakdown of the nationalities of passengers arriving at London Heathrow airport throughout 2019, and Table 4 shows the total number of terminal and transit passengers at London airports in 2019. a) 15%] Find a suitable approximation for the number of transit passengers X; at the airport. Show the mean and variance of this random variable. b) (35%] Estimate the number of gates that need to be open in order to ensure the queues of passengers waiting to go through passport control does not increase with time. Use the data in the tables provided alongside realistic estimates for the rate at which passengers go