

Question: Part 3 (2 pt): Continue using the new grouped dataframe. Which counties have an average reading score higher than 650? In the example output below,
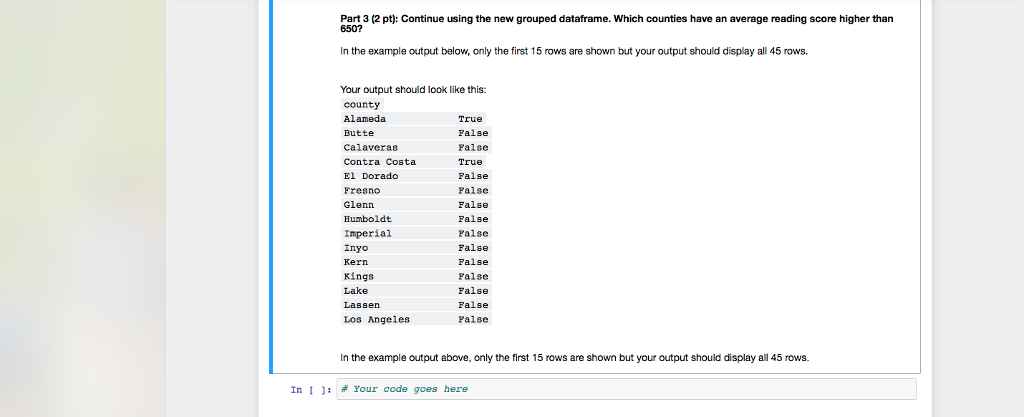
Part 3 (2 pt): Continue using the new grouped dataframe. Which counties have an average reading score higher than 650? In the example output below, only the first 15 rows are shown but your output should display all 45 rows. Your output should look like this: county Alameda Butte Calaveras Contra Costa El Dorado Fresnd Glenn Humboldt Imperial Inyo Kern Kings Lake Lassen Los Angeles False False False False False False False False False False False False False In the example output above, only the first 15 rows are shown but your output should display all 45 rows. In [ ]: # Your code goes here Part 3 (2 pt): Continue using the new grouped dataframe. Which counties have an average reading score higher than 650? In the example output below, only the first 15 rows are shown but your output should display all 45 rows. Your output should look like this: county Alameda Butte Calaveras Contra Costa El Dorado Fresnd Glenn Humboldt Imperial Inyo Kern Kings Lake Lassen Los Angeles False False False False False False False False False False False False False In the example output above, only the first 15 rows are shown but your output should display all 45 rows. In [ ]: # Your code goes here
Step by Step Solution
There are 3 Steps involved in it

Get step-by-step solutions from verified subject matter experts