

Question: Part 3. (7 points) Consider your random sample from Part 1b, provided it was obtained randomly your sample mean and standard deviation values are not
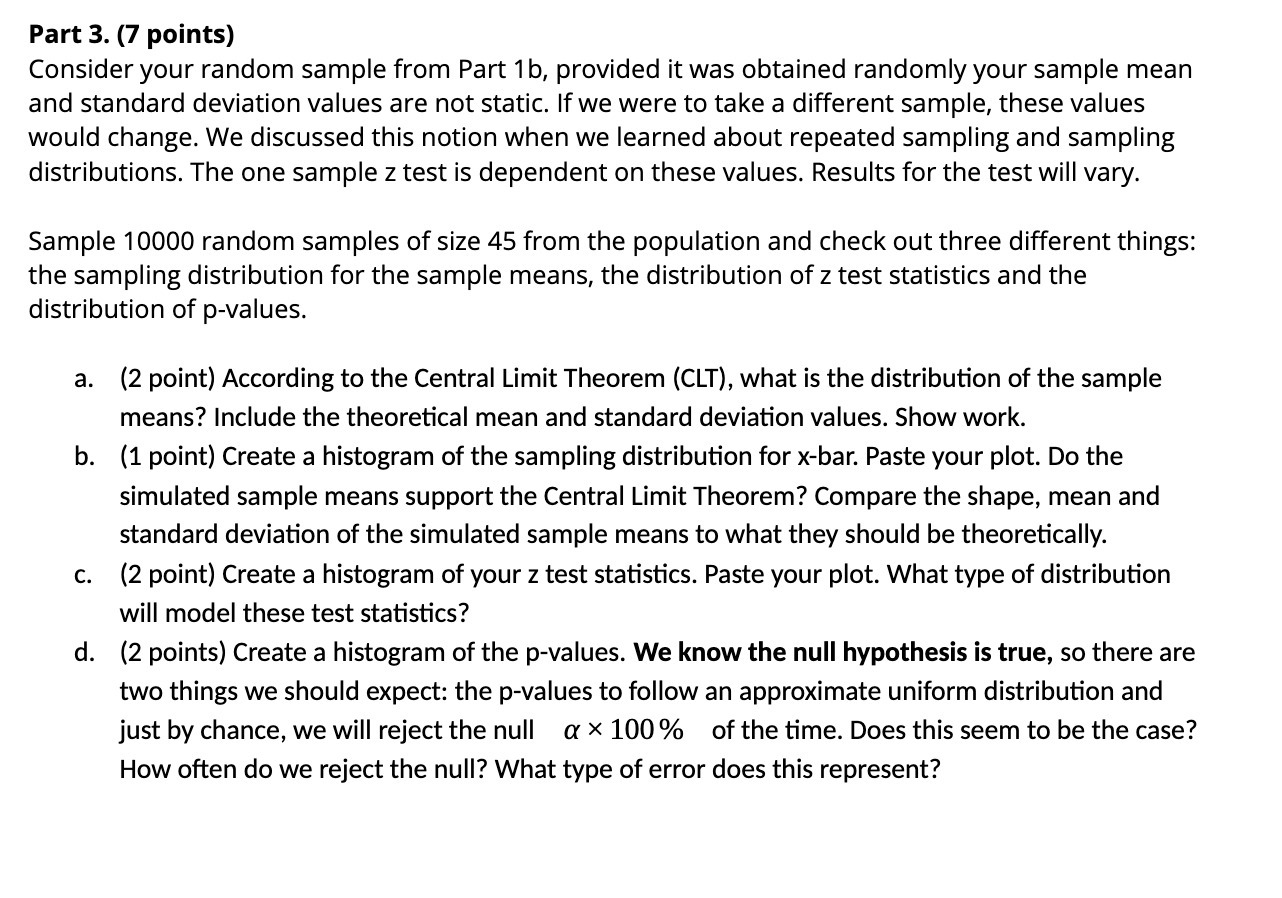
Part 3. (7 points) Consider your random sample from Part 1b, provided it was obtained randomly your sample mean and standard deviation values are not static. If we were to take a different sample, these values would change. We discussed this notion when we learned about repeated sampling and sampling distributions. The one sample 2 test is dependent on these values. Results for the test will vary. Sample 10000 random samples of size 45 from the population and check out three different things: the sampling distribution for the sample means, the distribution of 2 test statistics and the distribution of p-values. a. (2 point) According to the Central Limit Theorem (CLT), what is the distribution of the sample means? Include the theoretical mean and standard deviation values. Show work. b. (1 point) Create a histogram of the sampling distribution for xbar. Paste your plot. Do the simulated sample means support the Central Limit Theorem? Compare the shape, mean and standard deviation of the simulated sample means to what they should be theoretically. c. (2 point) Create a histogram of your 2 test statistics. Paste your plot. What type of distribution will model these test statistics? d. (2 points) Create a histogram of the pvalues. We know the null hypothesis is true, so there are two things we should expect: the pvalues to follow an approximate uniform distribution and just by chance, we will reject the null or X 100% of the time. Does this seem to be the case? How often do we reject the null? What type of error does this represent
Step by Step Solution
There are 3 Steps involved in it

Get step-by-step solutions from verified subject matter experts