

Question: PART 3 FINANCIAL FORECASTING (20 points) Using the historical financial statements provided, create pro forma financial statements of Urika Corporation using the following information for
PART 3 FINANCIAL FORECASTING (20 points)
Using the historical financial statements provided, create pro forma financial statements of Urika Corporation using the following information for status quo operations and with the Fast N Health project layered in as well.
For status quo, use the following assumptions or techniques:
- Grow sales by 7% annually
- Use the average percentage of sales to determine the cost of goods sold for current operations, then add the calculated cost of goods sold from the projects CBA.
- Use the Excel function TREND to determine Cash and SG&A using historical Sales as the independent variable (do not apply this to sales including Fast N Healthy since all of the SG&A costs are already included in the projects revenue stream).
- Use the current Cost of Capital to determine the Interest Expense on debt and apply this to the average of LAST and CURRENT years balance is Notes, Current Portion of LT Debt, and LT Debt.
- Use TREND to determine Accounts Receivable and Inventories with Sales as the independent variable; for this calculation, DO use total sales including revenue from the Fast N Healthy project.
- Include the projects PP&E with the status quos PP&E.
- Depreciation for status quo PP&E will be $5,855,000/year for all out-years. PLUS: Dont forget to add depreciation from Fast N Healthy to this.
- Assume Other Non Current Assets are $35,000,000 flat for all out-years.
- Assume $2M flat for Accounts Payable for all out-years.
- Use the prior 5 years average Accrued Expenses, Notes Payable, and Other Non Current Liabilities, and keep them flat for all out-years.
- Use $300,000 for the Current Portion of Long Term Debt, unless there is no long term debt
- Long Term Debt Reduce by the $300,000 Current Portion of Long Term Debt every year.
- Other Non Current Liabilities use the average of prior years and keep that flat.
- Additional Paid-in-Capital is not expected to change at this point.
- For Retained Earnings: determine the dividends paid in prior periods. Urika would like to grow dividends by 4% annually going forward.
- Use Other Current Assets as appropriate as a plug to balance the Balance Sheet using the method I show you in class. ASK IF YOU DONT KNOW!
Dont forget to add in the effects of the Fast N Healthy project.
Make sure your model and financial statements are professional in appearance and easy to navigate. Remember, a Senior Vice President will want to see and use your work when youre finished!
Please show formulas with work
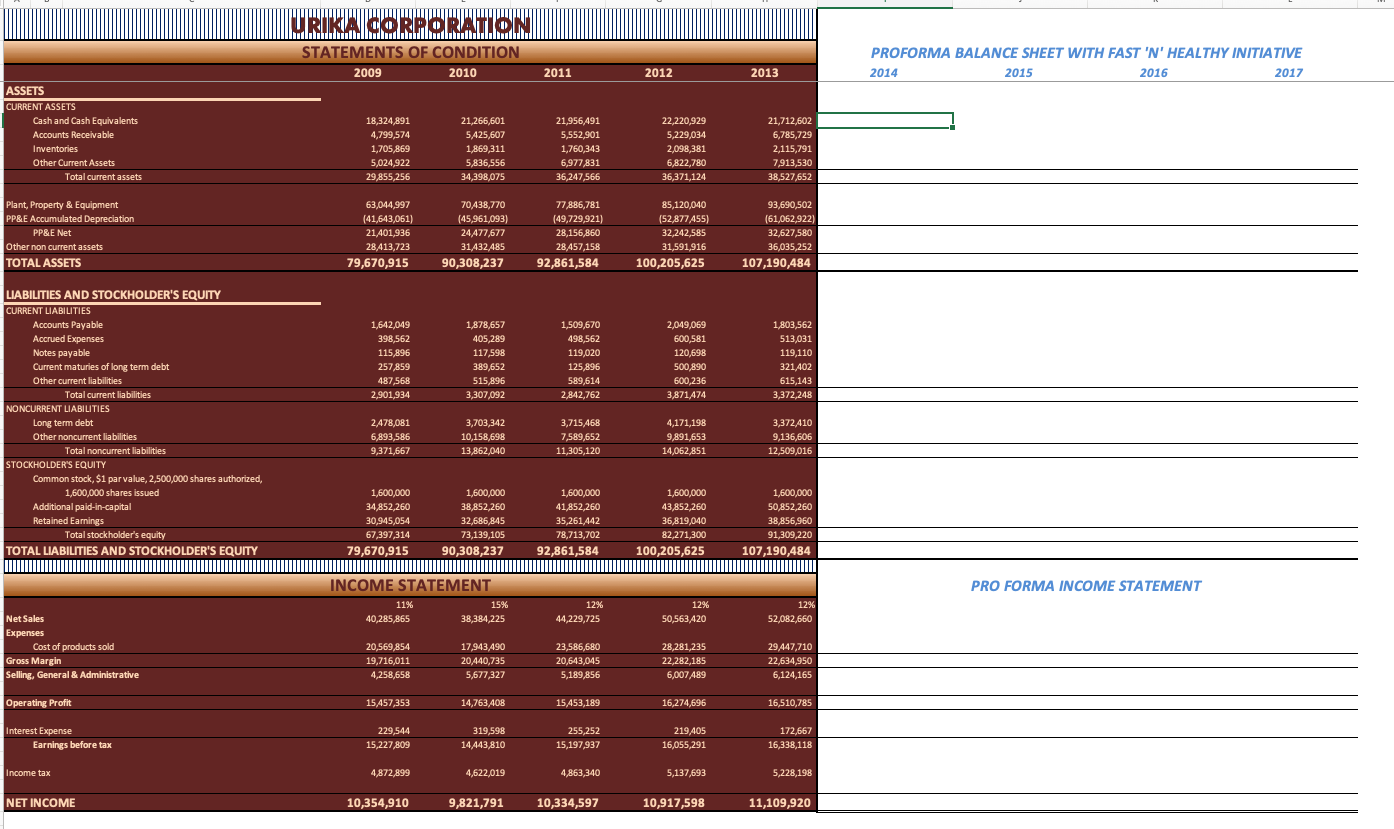
URIKA CORPORATION 000000000000000000 STATEMENTS OF CONDITION 2009 2010 2011 2012 PROFORMA BALANCE SHEET WITH FAST 'N' HEALTHY INITIATIVE 2014 2017 2013 2015 2016 ASSETS CURRENT ASSETS Cash and Cash Equivalents Accounts Receivable Inventories Other Current Assets Total current assets 18,324,891 4,799,574 1,705,869 5,024,922 29,855,256 21,266,601 5425,607 1,869,311 5,836,556 34,398,075 21,956,491 5,552,901 1,760,343 6,977,831 36,247,566 22,220,929 5,229,034 2,098,381 6,822,780 36,371,124 21,712,602 6,785,729 2,115,791 7,913,530 38,527,652 Plant, Property & Equipment PP&E Accumulated Depreciation PP&E Net Other non current assets TOTAL ASSETS 63,044,997 (41,643,061) 21,401,936 28,413,723 79,670,915 70,438,770 (45,961,093) 24,477,677 31,432,485 90,308,237 77,886,781 (49,729,921) 28,156,860 28,457,158 92,861,584 85,120,040 (52,877A55) 32,242,585 31,591,916 100,205,625 93,690,502 (61,062,922) 32,627,580 36,035,252 107,190,484 1,642,049 398,562 115,896 257,859 487,568 2,901,934 1,878,657 405,289 117,598 389,652 515,896 3,307,092 1,509,670 498,562 119,020 125,896 589,614 2,842,762 2,049,069 600,581 120,698 500,890 600,236 3,871474 1,803,562 513,031 119,110 321402 615,143 3,372,248 LIABILITIES AND STOCKHOLDER'S EQUITY CURRENT LIABILITIES Accounts Payable Accrued Expenses Notes payable Current maturies of long term debt Other current liabilities Total current liabilities NONCURRENT LIABILITIES Long term debt Other noncurrent liabilities Total noncurrent liabilities STOCKHOLDER'S EQUITY Common stock, $1 par value, 2,500,000 shares authorized, 1,600,000 shares issued Additional paid-in-capital Retained Earnings Total stockholder's equity TOTAL LIABILITIES AND STOCKHOLDER'S EQUITY 2,478,081 6,893,586 9,371,667 3,703,342 10,158,698 13,862,040 3,715,468 7,589,652 11,305,120 4,171,198 9,891,653 14,062,851 3,372,410 9,136,606 12,509,016 1,600,000 34,852,260 30,945,054 67,397,314 79,670,915 1,600,000 38,852,260 32,686,845 73,139,105 90,308,237 1,600,000 41,852,260 35,261,442 78,713,702 92,861,584 1,600,000 43,852,260 36,819,040 82,271,300 100,205,625 1,600,000 50,852,260 38,856,960 91,309,220 107,190,484 PRO FORMA INCOME STATEMENT INCOME STATEMENT 11% 15% 40,285,865 38,384,225 12% 44,229,725 12% 50,563 A20 12% 52,082,660 Net Sales Expenses Cost of products sold Gross Margin Selling, General & Administrative 20,569,854 19,716,011 4,258,658 17,943,490 20,440,735 5,677,327 23,586,680 20,643,045 5,189,856 28,281,235 22,282,185 6,007 A89 29,447,710 22,634,950 6,124,165 Operating Profit 15,457,353 14,763,408 15,453,189 16,274,696 16,510,785 Interest Expense Earnings before tax 229,544 15,227,809 319,598 14443,810 255,252 15,197,937 219.405 16,055,291 172,667 16,338,118 Income tax 4,872,899 4,622,019 4,863,340 5,137,693 5,228,198 NET INCOME 10,354,910 9,821,791 10,334,597 10,917,598 11,109,920 URIKA CORPORATION 000000000000000000 STATEMENTS OF CONDITION 2009 2010 2011 2012 PROFORMA BALANCE SHEET WITH FAST 'N' HEALTHY INITIATIVE 2014 2017 2013 2015 2016 ASSETS CURRENT ASSETS Cash and Cash Equivalents Accounts Receivable Inventories Other Current Assets Total current assets 18,324,891 4,799,574 1,705,869 5,024,922 29,855,256 21,266,601 5425,607 1,869,311 5,836,556 34,398,075 21,956,491 5,552,901 1,760,343 6,977,831 36,247,566 22,220,929 5,229,034 2,098,381 6,822,780 36,371,124 21,712,602 6,785,729 2,115,791 7,913,530 38,527,652 Plant, Property & Equipment PP&E Accumulated Depreciation PP&E Net Other non current assets TOTAL ASSETS 63,044,997 (41,643,061) 21,401,936 28,413,723 79,670,915 70,438,770 (45,961,093) 24,477,677 31,432,485 90,308,237 77,886,781 (49,729,921) 28,156,860 28,457,158 92,861,584 85,120,040 (52,877A55) 32,242,585 31,591,916 100,205,625 93,690,502 (61,062,922) 32,627,580 36,035,252 107,190,484 1,642,049 398,562 115,896 257,859 487,568 2,901,934 1,878,657 405,289 117,598 389,652 515,896 3,307,092 1,509,670 498,562 119,020 125,896 589,614 2,842,762 2,049,069 600,581 120,698 500,890 600,236 3,871474 1,803,562 513,031 119,110 321402 615,143 3,372,248 LIABILITIES AND STOCKHOLDER'S EQUITY CURRENT LIABILITIES Accounts Payable Accrued Expenses Notes payable Current maturies of long term debt Other current liabilities Total current liabilities NONCURRENT LIABILITIES Long term debt Other noncurrent liabilities Total noncurrent liabilities STOCKHOLDER'S EQUITY Common stock, $1 par value, 2,500,000 shares authorized, 1,600,000 shares issued Additional paid-in-capital Retained Earnings Total stockholder's equity TOTAL LIABILITIES AND STOCKHOLDER'S EQUITY 2,478,081 6,893,586 9,371,667 3,703,342 10,158,698 13,862,040 3,715,468 7,589,652 11,305,120 4,171,198 9,891,653 14,062,851 3,372,410 9,136,606 12,509,016 1,600,000 34,852,260 30,945,054 67,397,314 79,670,915 1,600,000 38,852,260 32,686,845 73,139,105 90,308,237 1,600,000 41,852,260 35,261,442 78,713,702 92,861,584 1,600,000 43,852,260 36,819,040 82,271,300 100,205,625 1,600,000 50,852,260 38,856,960 91,309,220 107,190,484 PRO FORMA INCOME STATEMENT INCOME STATEMENT 11% 15% 40,285,865 38,384,225 12% 44,229,725 12% 50,563 A20 12% 52,082,660 Net Sales Expenses Cost of products sold Gross Margin Selling, General & Administrative 20,569,854 19,716,011 4,258,658 17,943,490 20,440,735 5,677,327 23,586,680 20,643,045 5,189,856 28,281,235 22,282,185 6,007 A89 29,447,710 22,634,950 6,124,165 Operating Profit 15,457,353 14,763,408 15,453,189 16,274,696 16,510,785 Interest Expense Earnings before tax 229,544 15,227,809 319,598 14443,810 255,252 15,197,937 219.405 16,055,291 172,667 16,338,118 Income tax 4,872,899 4,622,019 4,863,340 5,137,693 5,228,198 NET INCOME 10,354,910 9,821,791 10,334,597 10,917,598 11,109,920
Step by Step Solution
There are 3 Steps involved in it

Get step-by-step solutions from verified subject matter experts