

Question: Part 3 - Regression Analysis Gina's Boutiques has 12 locations in the Mid-Atlantic region. Revenues and Costs for each store are given in the
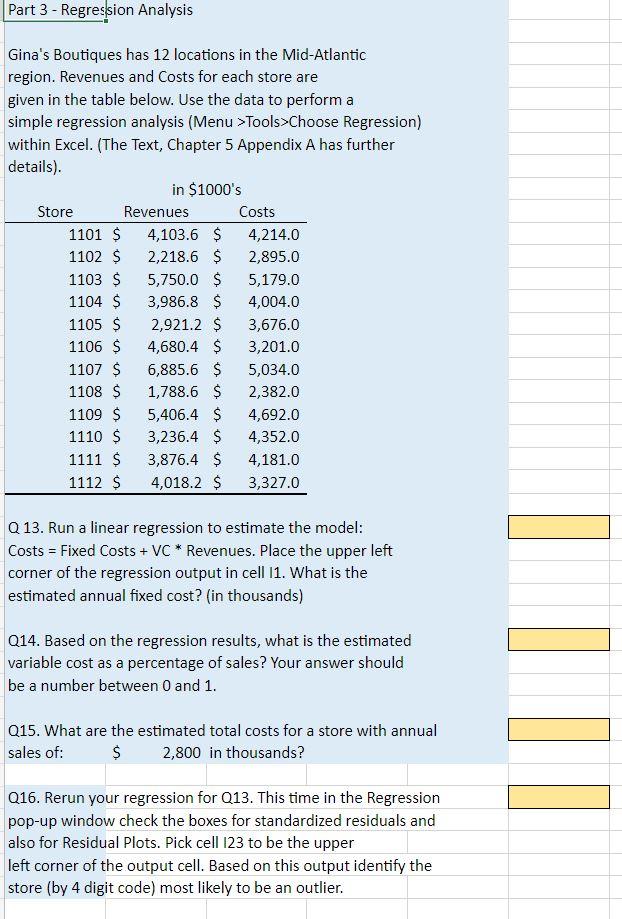
Part 3 - Regression Analysis Gina's Boutiques has 12 locations in the Mid-Atlantic region. Revenues and Costs for each store are given in the table below. Use the data to perform a simple regression analysis (Menu >Tools>Choose Regression) within Excel. (The Text, Chapter 5 Appendix A has further details). Store 1101 $ 1102 $ 1103 $ 1104 $ 1105 $ 1106 $ 1107 $ 1108 $ 1109 $ 1110 $ 1111 $ 1112 $ in $1000's Revenues 4,103.6 $ 2,218.6 $ 5,750.0 $ 3,986.8 $ 2,921.2 $ 4,680.4 $ 6,885.6 $ 1,788.6 $ 5,406.4 $ 3,236.4 $ 3,876.4 $ 4,018.2 $ Costs 4,214.0 2,895.0 5,179.0 4,004.0 3,676.0 3,201.0 5,034.0 2,382.0 4,692.0 4,352.0 4,181.0 3,327.0 Q 13. Run a linear regression to estimate the model: Costs = Fixed Costs + VC * Revenues. Place the upper left corner of the regression output in cell 11. What is the estimated annual fixed cost? (in thousands) Q14. Based on the regression results, what is the estimated variable cost as a percentage of sales? Your answer should be a number between 0 and 1. Q15. What are the estimated total costs for a store with annual sales of: $ 2,800 in thousands? Q16. Rerun your regression for Q13. This time in the Regression pop-up window check the boxes for standardized residuals and also for Residual Plots. Pick cell 123 to be the upper left corner of the output cell. Based on this output identify the store (by 4 digit code) most likely to be an outlier.
Step by Step Solution
3.43 Rating (150 Votes )
There are 3 Steps involved in it
Answer Using Excel go to Data select Data Analysis choose Regression Put Revenue in Y input range an... View full answer

Get step-by-step solutions from verified subject matter experts