

Question: Part 3: Satisfaction Driver Analysis Scenario: This is a customer survey done for a chain of veterinary clinics. Pet owners were surveyed. Their attitudes were
Part 3: Satisfaction Driver Analysis Scenario:
This is a customer survey done for a chain of veterinary clinics. Pet owners were surveyed. Their attitudes were measured, in addition to brand equity, satisfaction, loyalty, and some demographics. The owners of the clinics would like to know the key drivers of customer satisfaction. They think that attitudes towards pets and pet ownership may influence satisfaction in addition to the actual customer experience (and pet experience) during a visit to one of their clinics.
What is required? To test the hypotheses proposed by the clinic owners, a multiple regression analysis is needed. However, there are too many attitude measures. They need to be reduced to a manageable subset. Then using both this reduced set of attitude variables and other variables relating to clinic experience, a regression analysis can be conducted. Steps 1. Use the Pet-Owners-Attitude.csv file. 2. Bring this file into JASP. Use Factor/Principal Components Analysis. Set Eigenvalues above as 1; Set Rotation/orthogonal as varimax; ask for factor correlations in output. There should be 8 factors. See the questions/items that are loading together in the same column. Looked at the attached survey and see if you can provide a description to each principal component (for instance, a set of items that load on a component may be related to the owners close relationship with the pet). Give a title each column or principal component based on your interpretation. Save this information. Rest of this exercise involves RapidMiner. 3. Follow the process laid out below. Select all the variables starting with Att. Try different settings for PCA (adjusting variance value and adjusting fixed number of components in the parameters of the PCA operator. See what happens. Then fix the number of components to 8. 4. Write the output to a CSV file. Be sure to set the delimiter to a comma (not semi-colon) in the parameter of the Write SSV operator.
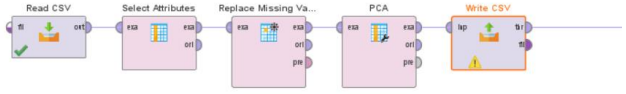
5. View the PCA results to see which questions are grouped together. Try to see if there is a relationship among the questions that are grouped together in each principal component. If there is something common among the questions, then each component can be given a suitable name (for instance, one component may have all questions related to relationship with pet) If there is no relationship that you can detect, that is OK. 6. Open the original data file in Excel. Open the newly written CSV file in Excel.
Copy the following columns to the right of the 8 PCA columns. Save the file (may want to give it a new name not essential). There should be 30 columns. SHours SLocation SFriendStaff SKnowledge SPrices SFriendVet SCaring SRangeService MeetExceed HighlySatis AdeqAddress Continue Recommend BEGoIntead BEFeatures BEAsGood BENotDiff BEUnique BEQltyServ BEPopular Gender Age 8. Bring this new file into RapidMiner to conduct the satisfaction driver analysis. 9. First use HighlySatis as the label, the 8 PCAs and the 8 attribute satisfaction variables (starting with the letter S in the above list) should be used as independent. Use T-test under feature selection in the Linear Regression parameter. You can repeat this analysis by trying MeetExceed instead of HighlySatis as the dependent variable. 10. Follow the process below. Set role and split data.
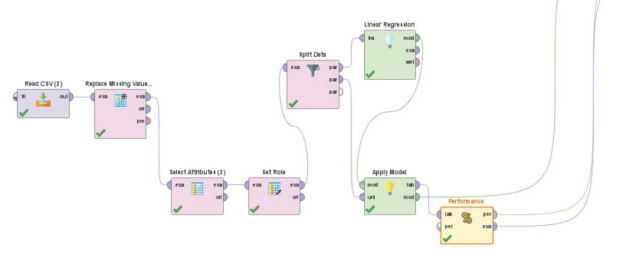
11. Be sure to report r-square, standardized coefficient, with corresponding t-values and significance levels. 12. Next, use the Generate Attribute operator to create a new variable. There are six brand equity measures (starting with BE), add them all into one variable. In this operator in the parameters, click on icon next to functional expression and click on each BE item and put a plus sign between them, give the new variable a name (brand_equity). 13. Use brand_equity as the dependent, the 8 principal components and HighlySatis as independent. Run the regression. Report results similar to Satisfaction Drivers regression. 14. Provide a thorough explanation of results (separately for satisfaction as dependent, and brand equity as dependent) and managerial implications. Write-up the assignment based on instructions provided in the first page of this guideline document.
Read CSV Select Attributes Replace Missing Va... PCA Write CSV ort es esa ti ori ol ori pre pre Linear Region Spilt Dute Red CV) Replace Ming V Select Sat Role Apoyo E Performance Read CSV Select Attributes Replace Missing Va... PCA Write CSV ort es esa ti ori ol ori pre pre Linear Region Spilt Dute Red CV) Replace Ming V Select Sat Role Apoyo E Performance
Step by Step Solution
There are 3 Steps involved in it

Get step-by-step solutions from verified subject matter experts