

Question: Part 3 Using the figures provided you will calculate the following for the XYZ store 1. Open to buy for each month 2. Average monthly
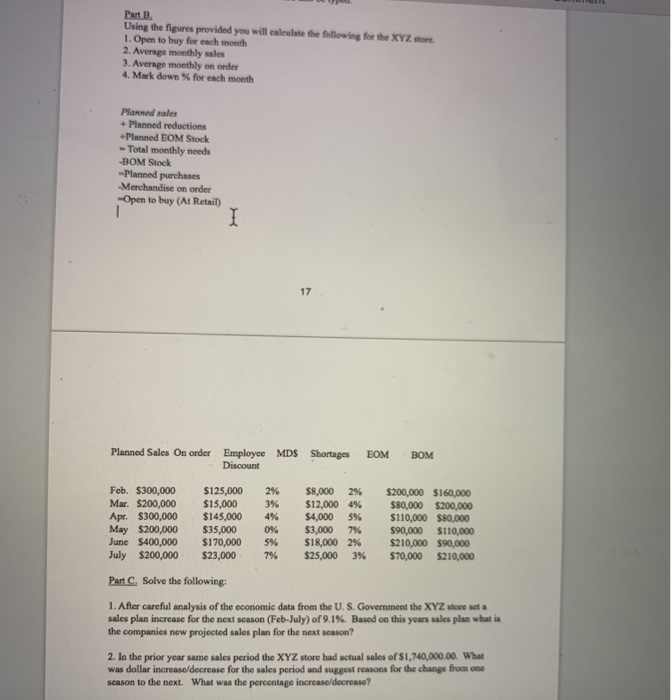
Part 3 Using the figures provided you will calculate the following for the XYZ store 1. Open to buy for each month 2. Average monthly sales 3. Average monthly on order 4. Mark down % for each month Planned sales Planned reductions Planned EOM Stock - Total monthly needs -BOM Stock -Planned purchases -Merchandise on order -Open to buy (At Retail) I 17 Planned Sales On order Employee MDS Shortages Discount EOM BOM Feb. $300,000 $125,000 2% $8,000 2% $200,000 $160,000 Mar. $200,000 $15,000 3% $12,000 4% $80,000 $200,000 Apr. $300,000 $145,000 $4,000 5% $110,000 $80,000 May $200,000 $35,000 0% $3,000 7% $90,000 $110,000 June $400,000 $170,000 5% $18,000 2% $210,000 $90,000 July $200,000 $23,000 7% $25,000 3% $70,000 $210,000 Part Solve the following: 1. After careful analysis of the economic data from the U.S. Government the XYZ store set a sales plan increase for the next season (Feb July) of 9.1%. Based on this years sales plan what is the companies new projected sales plan for the next seasom? 2. In the prior year same sales period the XYZ store had actual sales of $1,740,000.00. What was dollar increase/decrease for the sales period and suggest reasons for the change from one season to the next. What was the percentage increase/decrease? Part 3 Using the figures provided you will calculate the following for the XYZ store 1. Open to buy for each month 2. Average monthly sales 3. Average monthly on order 4. Mark down % for each month Planned sales Planned reductions Planned EOM Stock - Total monthly needs -BOM Stock -Planned purchases -Merchandise on order -Open to buy (At Retail) I 17 Planned Sales On order Employee MDS Shortages Discount EOM BOM Feb. $300,000 $125,000 2% $8,000 2% $200,000 $160,000 Mar. $200,000 $15,000 3% $12,000 4% $80,000 $200,000 Apr. $300,000 $145,000 $4,000 5% $110,000 $80,000 May $200,000 $35,000 0% $3,000 7% $90,000 $110,000 June $400,000 $170,000 5% $18,000 2% $210,000 $90,000 July $200,000 $23,000 7% $25,000 3% $70,000 $210,000 Part Solve the following: 1. After careful analysis of the economic data from the U.S. Government the XYZ store set a sales plan increase for the next season (Feb July) of 9.1%. Based on this years sales plan what is the companies new projected sales plan for the next seasom? 2. In the prior year same sales period the XYZ store had actual sales of $1,740,000.00. What was dollar increase/decrease for the sales period and suggest reasons for the change from one season to the next. What was the percentage increase/decrease
Step by Step Solution
There are 3 Steps involved in it

Get step-by-step solutions from verified subject matter experts