

Question: PART 4- A flow-chart for generating motion data In this question, you are going to investigate the programming steps required to generate motion data over
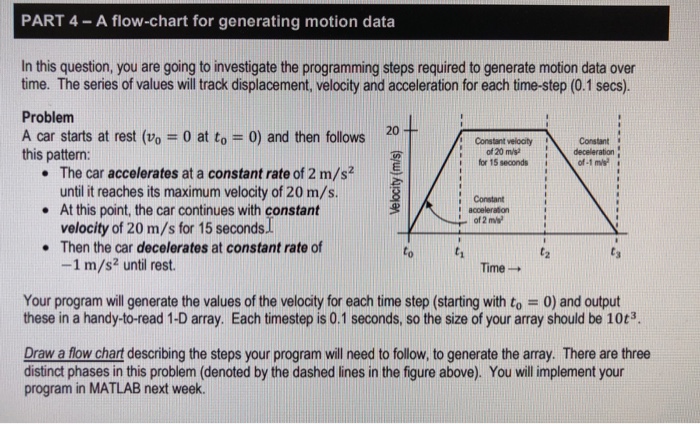
PART 4- A flow-chart for generating motion data In this question, you are going to investigate the programming steps required to generate motion data over time. The series of values will track displacement, velocity and acceleration for each time-step (0.1 secs) Problem A car starts at rest (vo- 0 at to 0) and then follows 20 this pattern: Constant velootydceleration of 20 mConstant I for 15 seconds The car accelerates at a constant rate of 2 m/s2 until it reaches its maximum velocity of 20 m/s. Constant .At this point, the car continues with constant of 2 mb velocity of 20 m/s for 15 seconds. Then the car decelerates at constant rate of -1 m/s until rest. to Time Your program will generate the values of the velocity for each time step (starting with to 0) and output these in a handy-to-read 1-D array. Each timestep is 0.1 seconds, so the size of your array should be 10t3 Draw a flow chart describing the steps your program will need to follow, to generate the array. There are three distinct phases in this problem (denoted by the dashed lines in the figure above). You ill implement your program in MATLAB next week
Step by Step Solution
There are 3 Steps involved in it

Get step-by-step solutions from verified subject matter experts