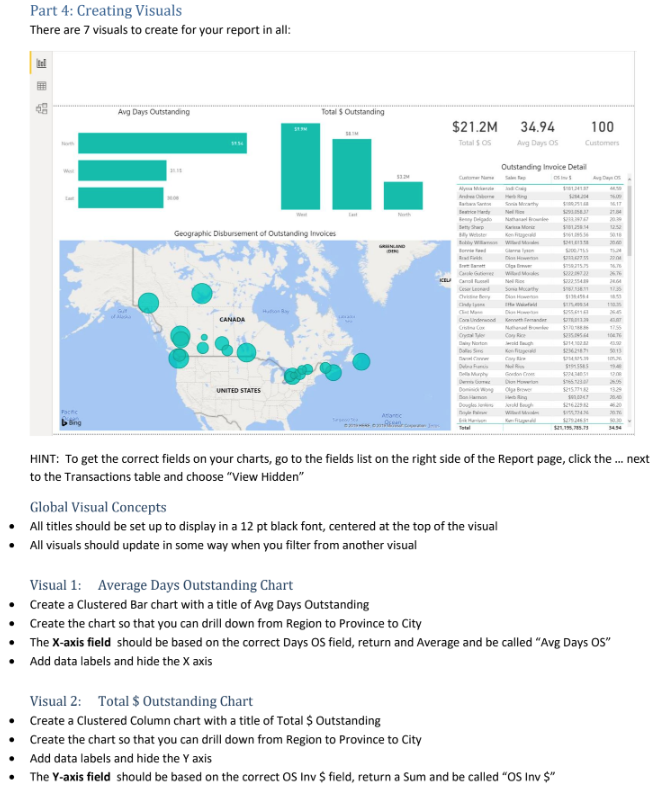
Question: Part 4: Creating Visuals There are 7 visuals to create for your report in all: Avg Days Outstanding Total $ Outstanding $21.2M 34.94 100 Total

Part 4: Creating Visuals There are 7 visuals toPart 4: Creating Visuals There are 7 visuals to
Part 4: Creating Visuals There are 7 visuals to create for your report in all: Avg Days Outstanding Total $ Outstanding $21.2M 34.94 100 Total $ 05 Avg Days OS Customers Outstanding Invoice Detail Geographic Disbursement of Outstanding Invoices Buty Sharp Canal lusual chily I pana CANADA 30:13 Dell Murphy UNITED STATES 13.29 Le Bing HINT: To get the correct fields on your charts, go to the fields list on the right side of the Report page, click the ... next to the Transactions table and choose "View Hidden" Global Visual Concepts All titles should be set up to display in a 12 pt black font, centered at the top of the visual All visuals should update in some way when you filter from another visual Visual 1: Average Days Outstanding Chart Create a Clustered Bar chart with a title of Avg Days Outstanding Create the chart so that you can drill down from Region to Province to City The X-axis field should be based on the correct Days OS field, return and Average and be called "Avg Days OS" Add data labels and hide the X axis Visual 2: Total $ Outstanding Chart Create a Clustered Column chart with a title of Total $ Outstanding Create the chart so that you can drill down from Region to Province to City Add data labels and hide the Y axis The Y-axis field should be based on the correct OS Inv $ field, return a Sum and be called "OS Inv $"Visual 3: Geographic Disbursement of Outstanding Invoices Map Create a Map chart with a title of \"Geographic Disbursement of Outstanding Invoices\" No drilling should be necessary to view this chart Control the Size of the bubbles by using the OS Inv $ field Ensure that the data types are classified correctly for all regional fields Visual 4: Total $ OS Card Create a Card that shows the Total $ 05 Visual 5: Avg Days 05 Card Create a Card that shows the Avg Days OS Visual 6: Customers Card Create a Card that shows the number of unique Customers Visual 7: Outstanding Invoice Detail Create a Table that shows the Customer Name, Sales Rep, OS Inv $ and the Avg Days OS

Step by Step Solution

There are 3 Steps involved in it

1 Expert Approved Answer
Step: 1 Unlock blur-text-image
Question Has Been Solved by an Expert!

Get step-by-step solutions from verified subject matter experts

Step: 2 Unlock
Step: 3 Unlock

Students Have Also Explored These Related Accounting Questions!