

Question: Part 4 For the data set find the standard deviation for the grouped data using the frequency distribution table. Hint: You can use one to


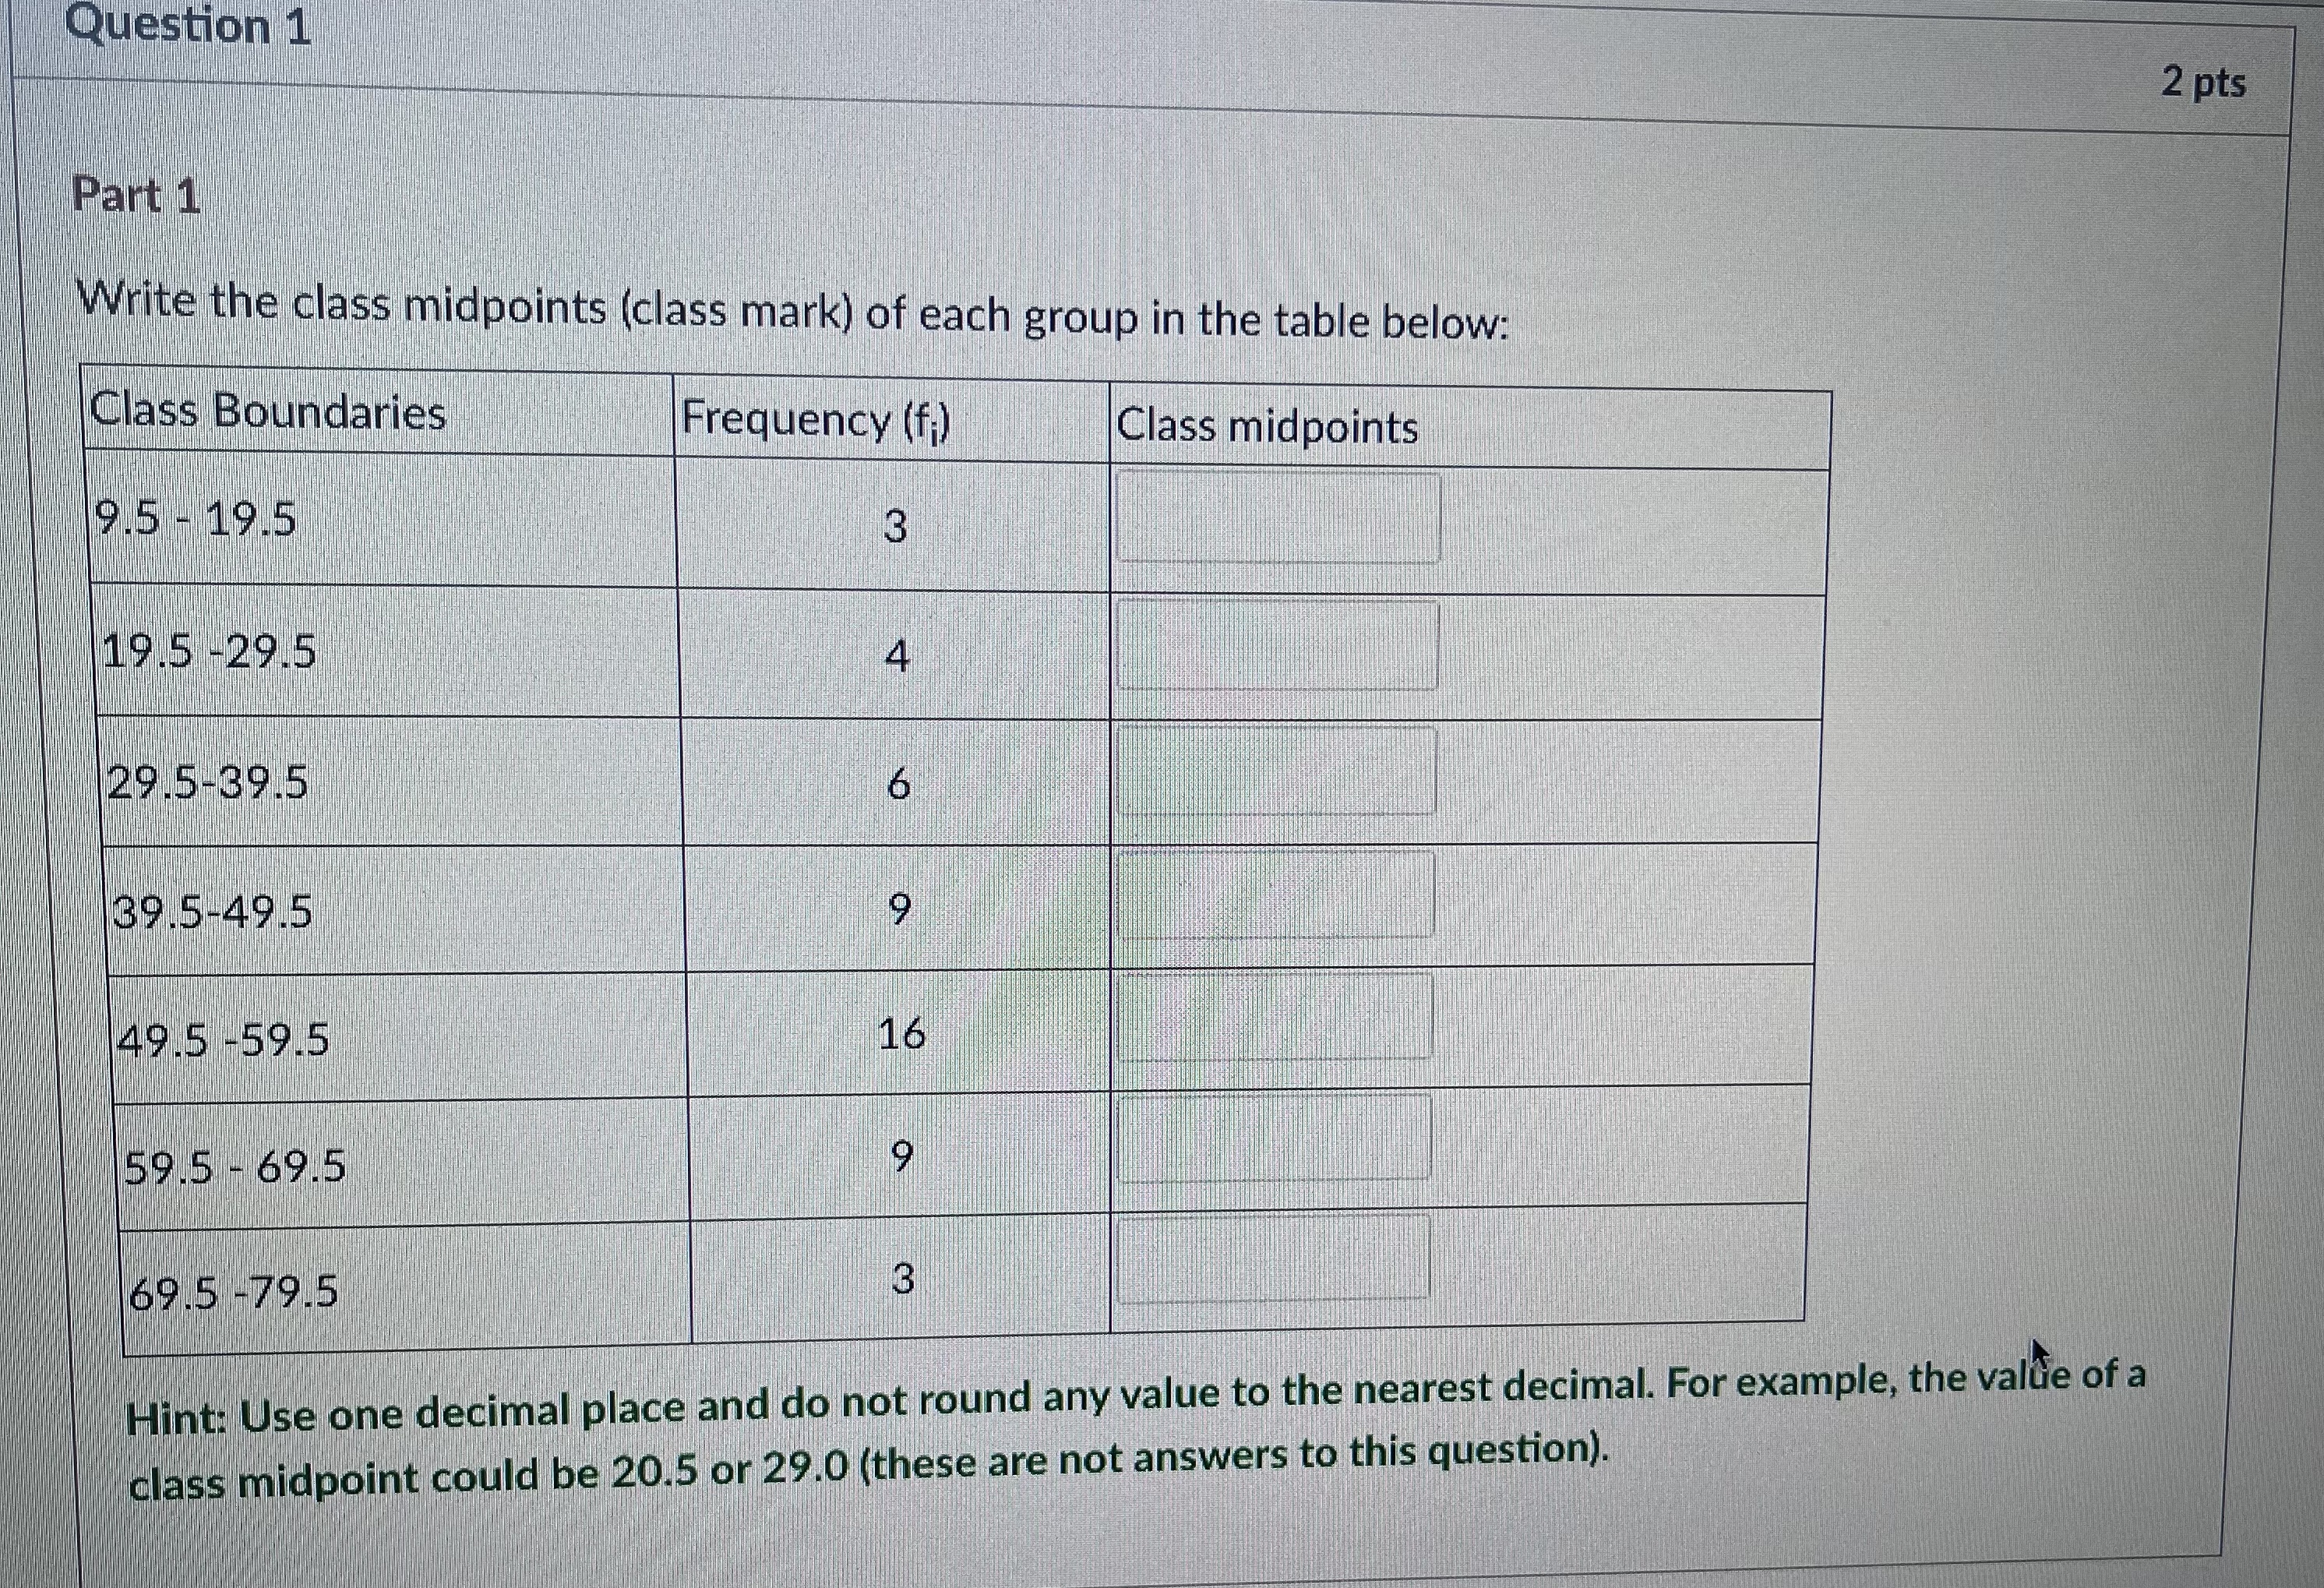
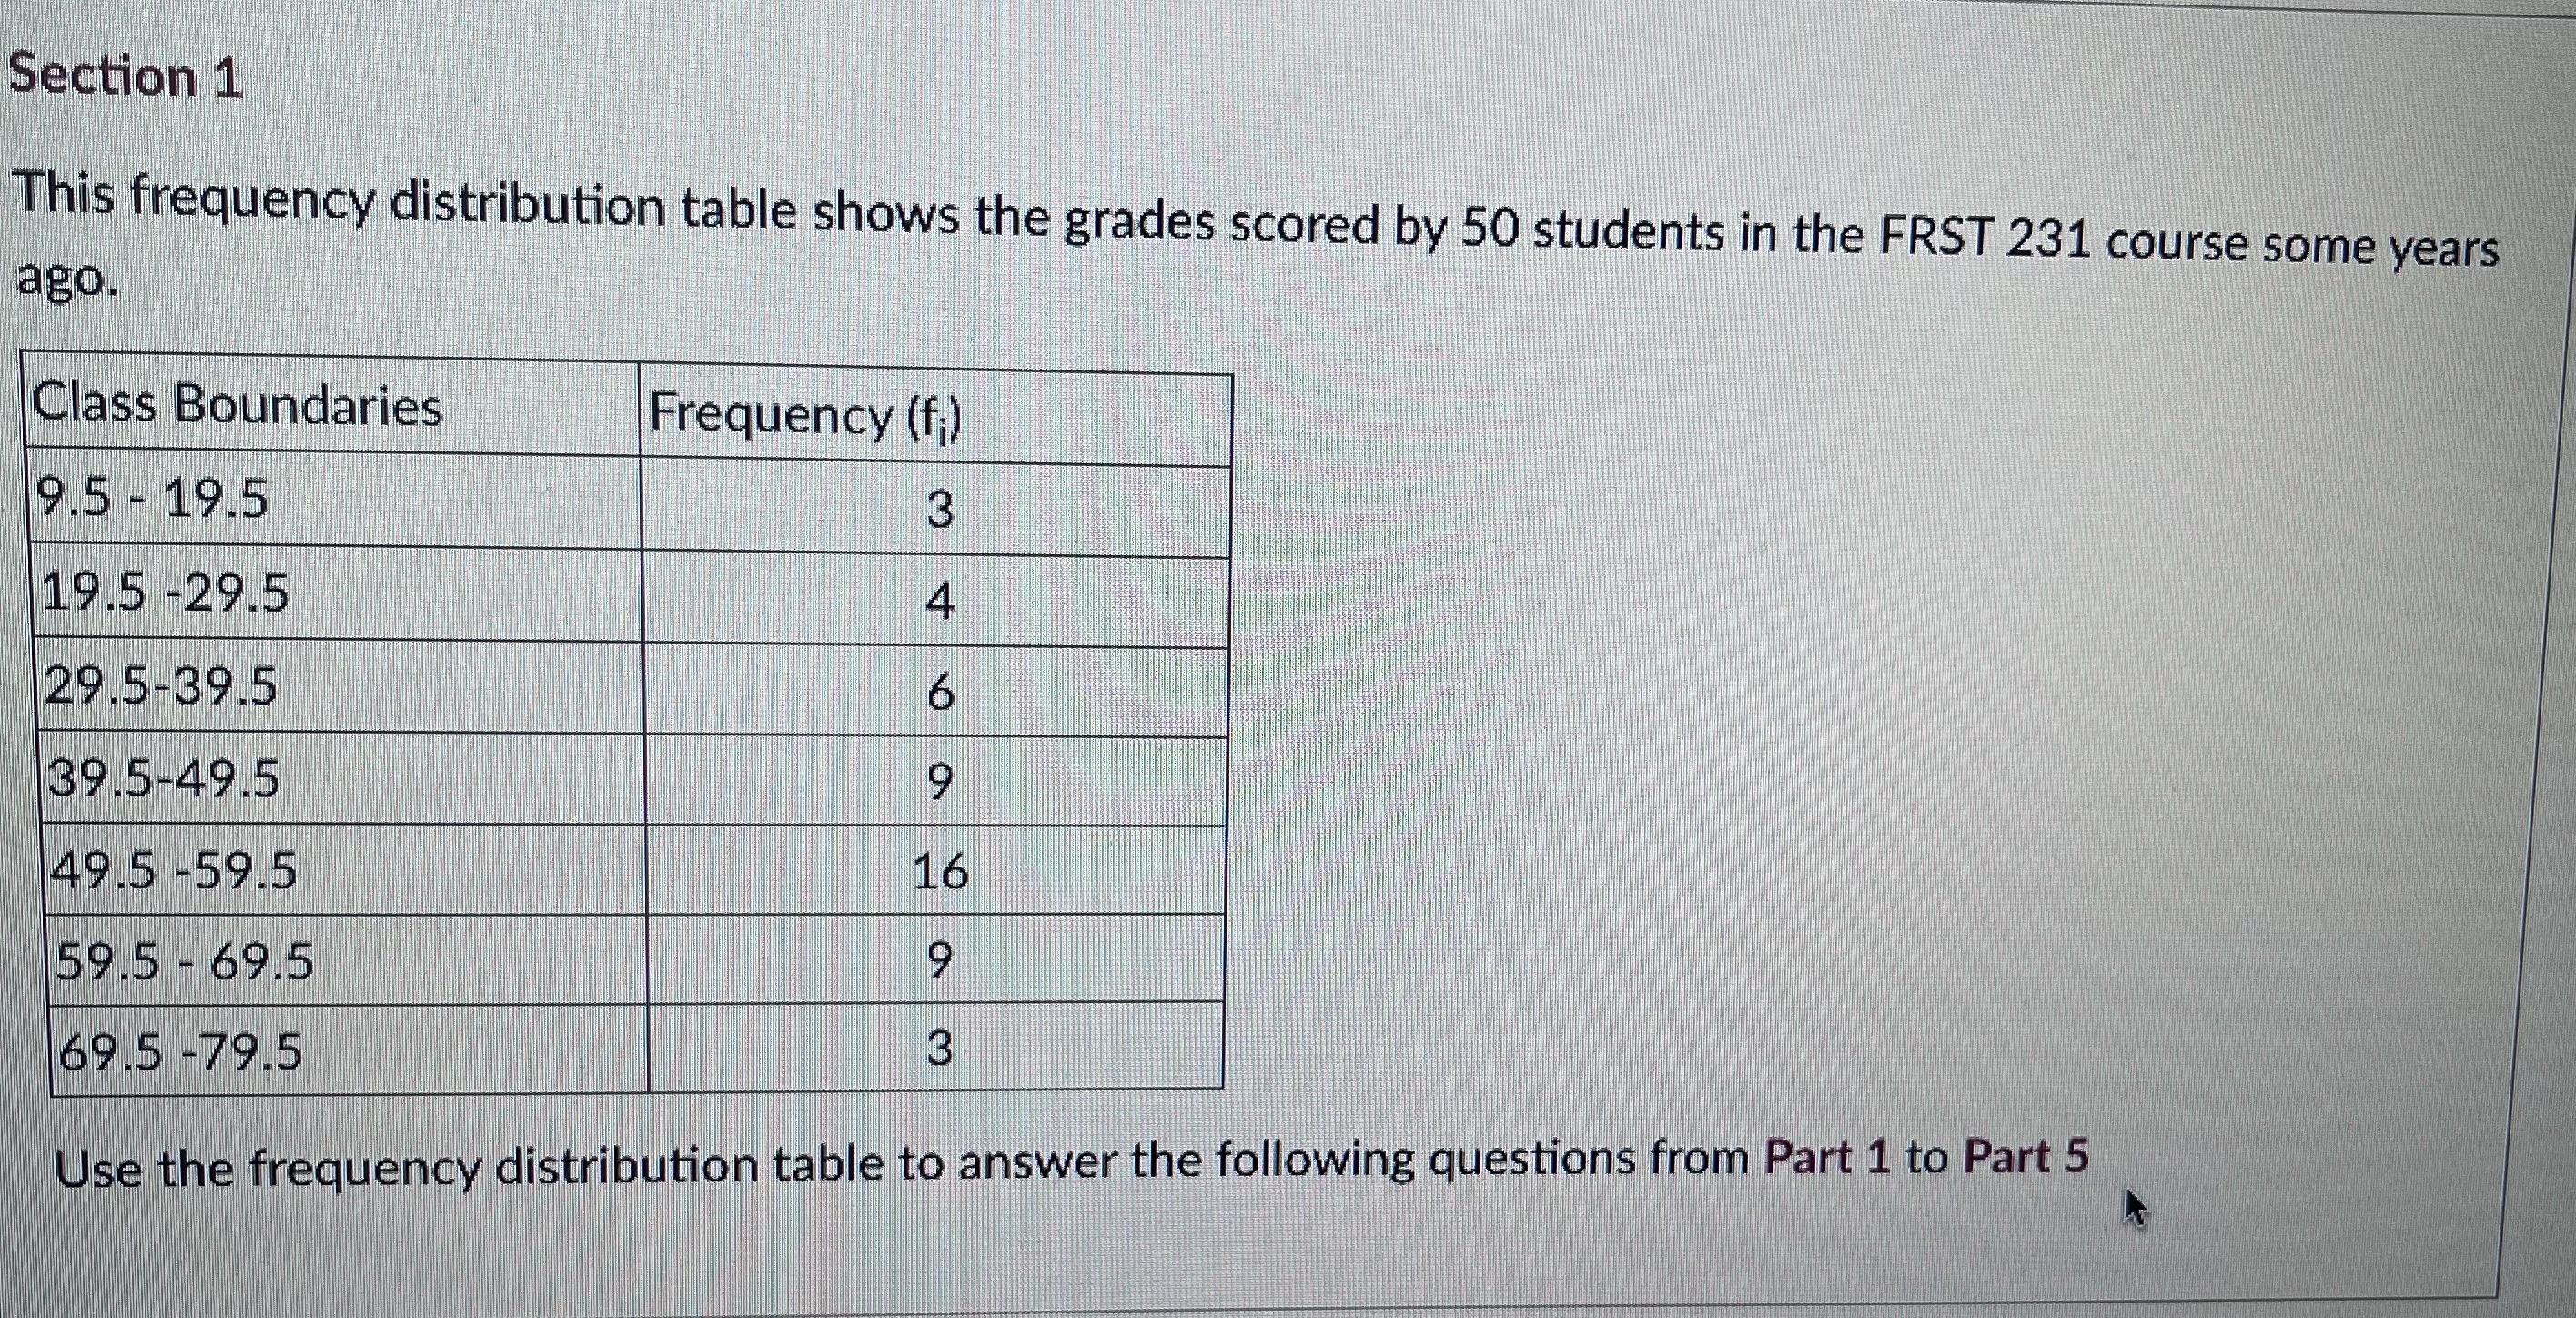
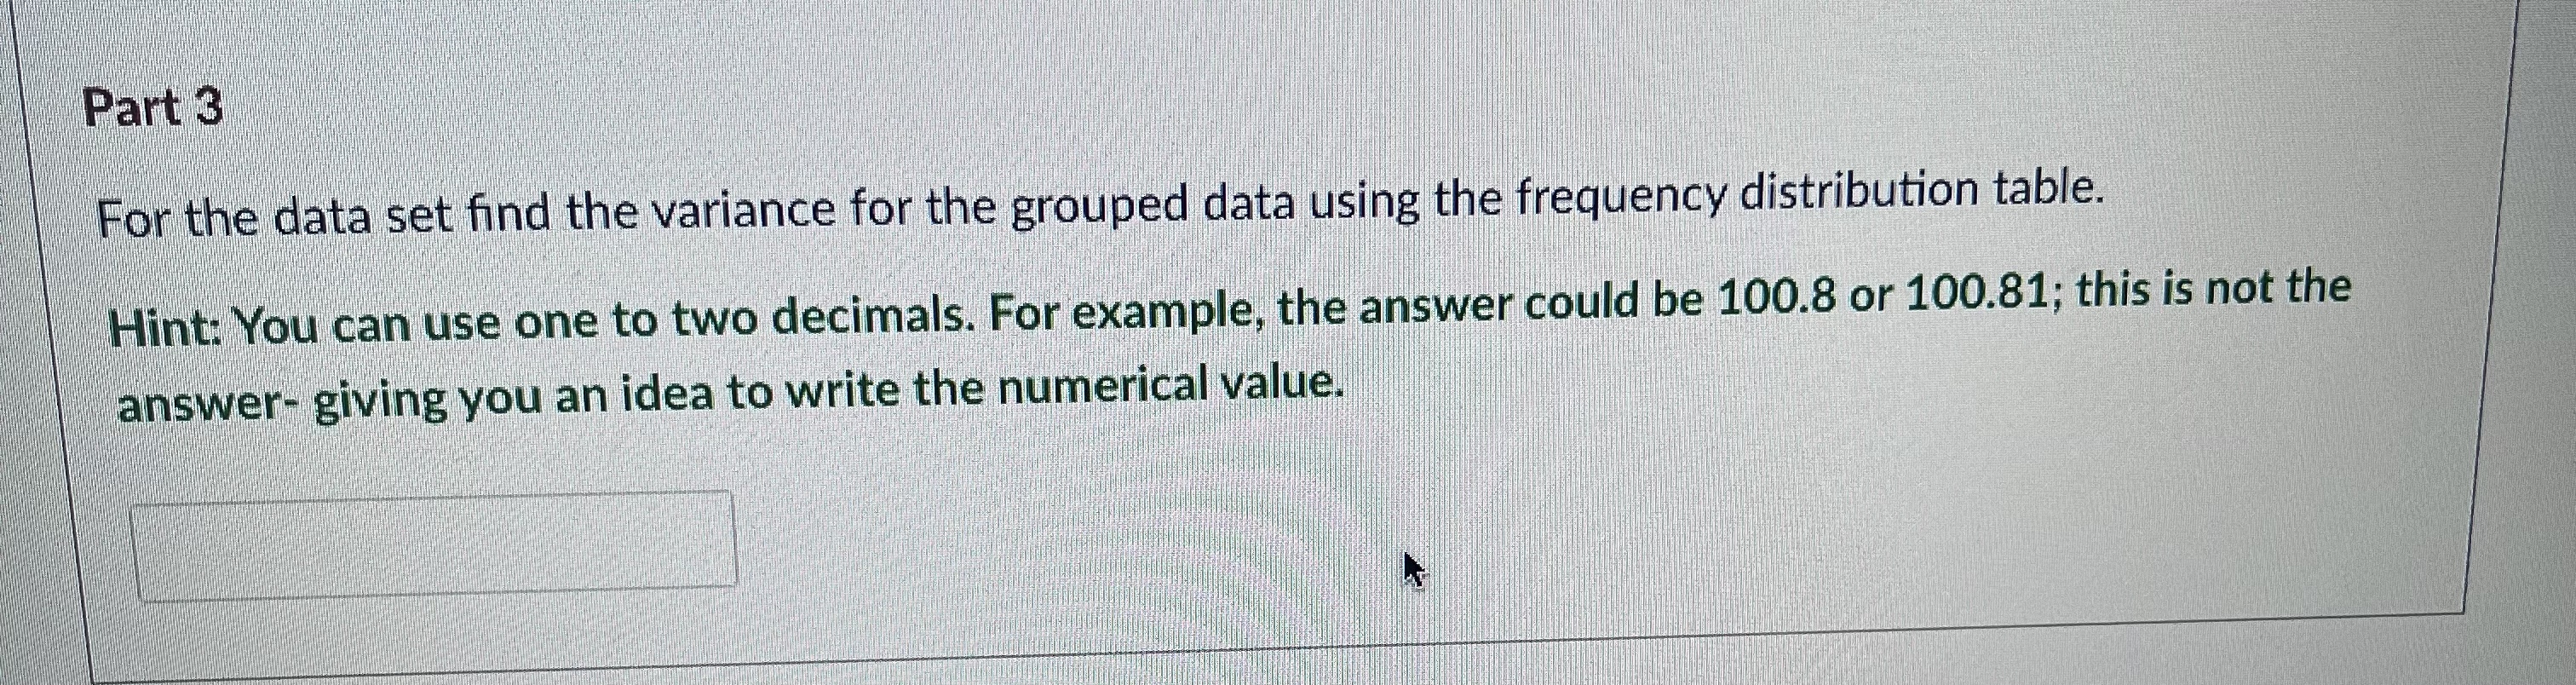

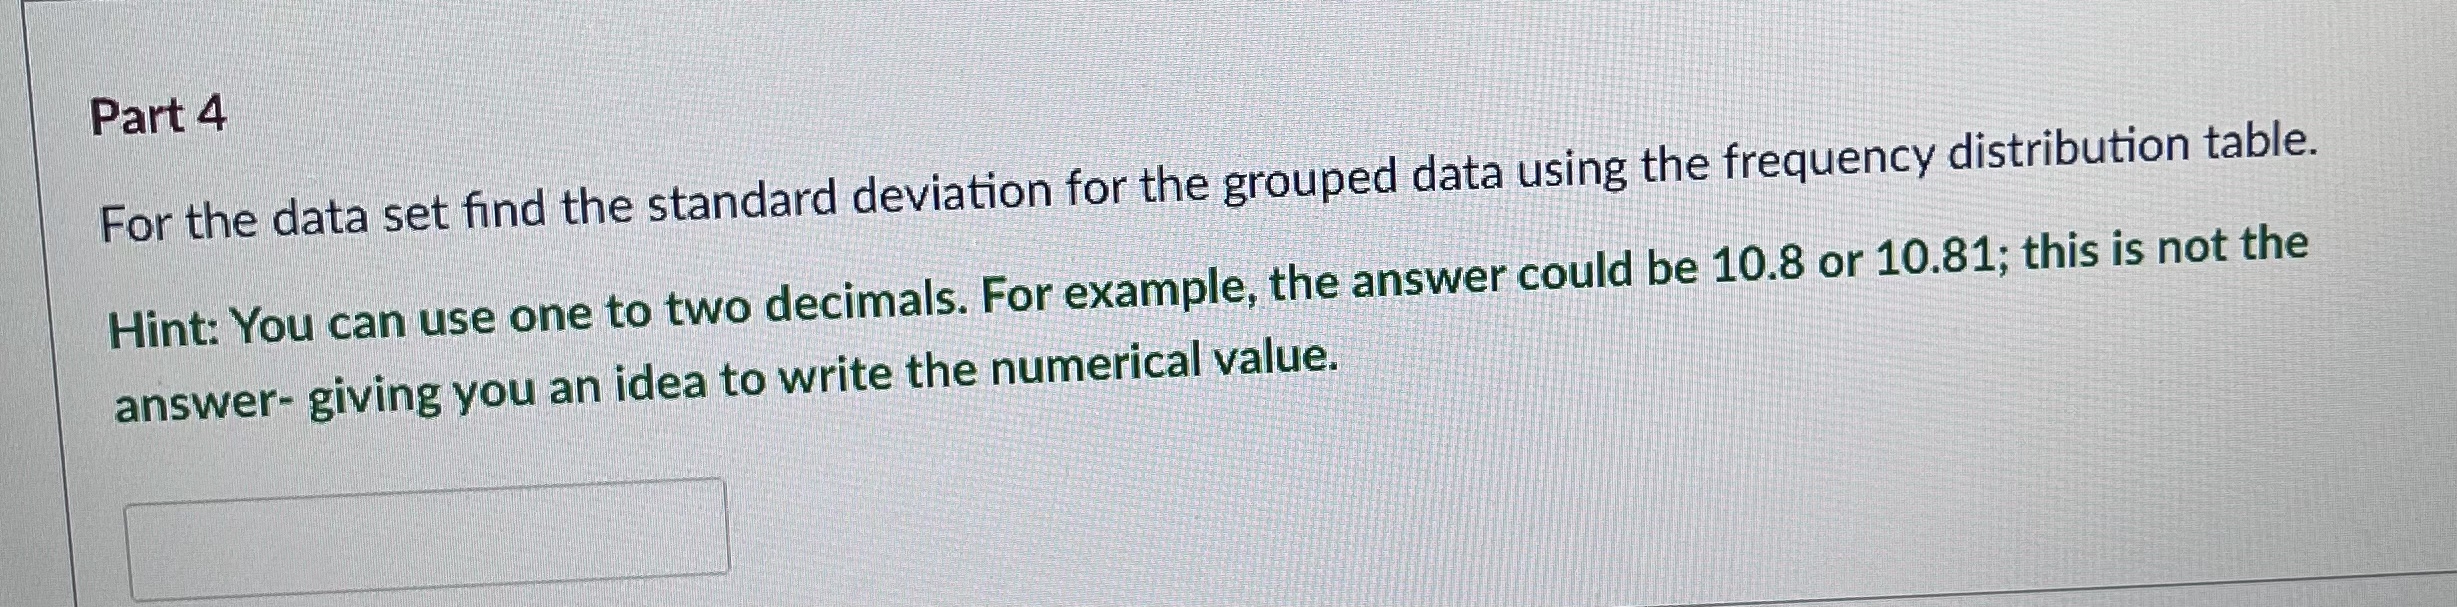
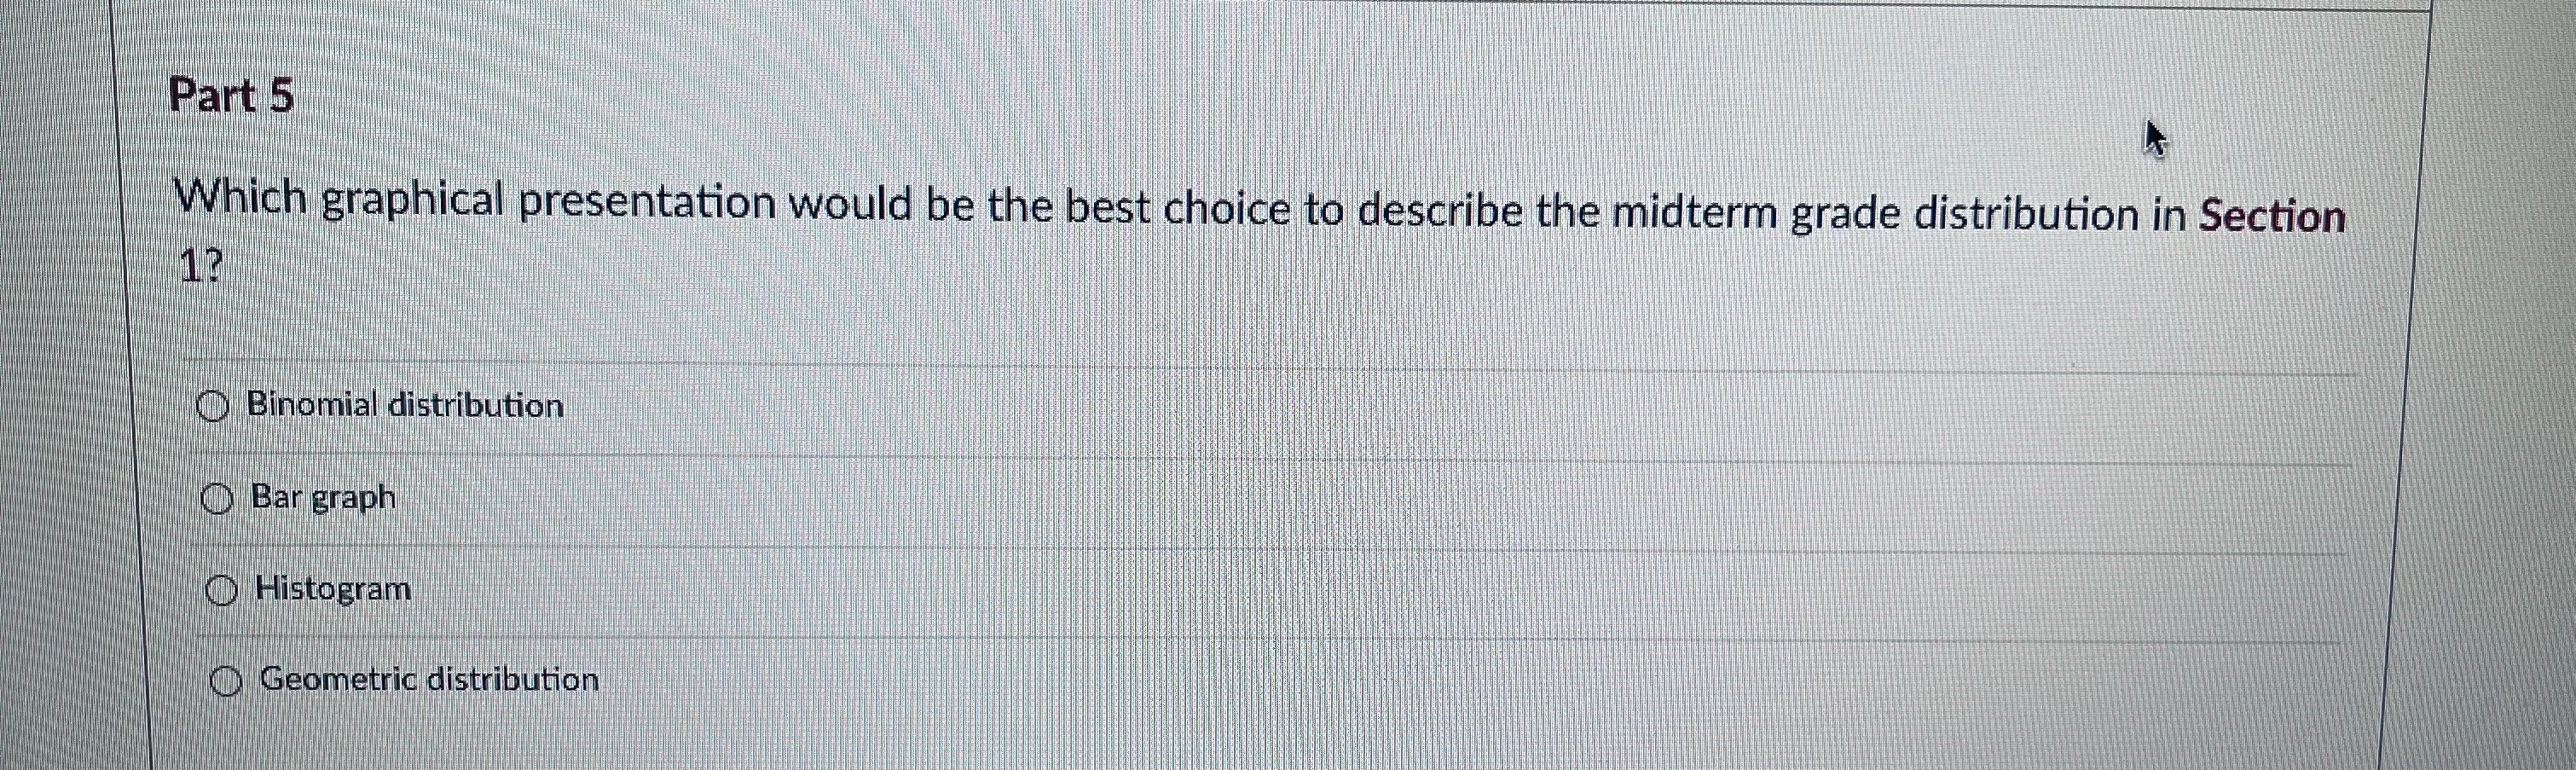


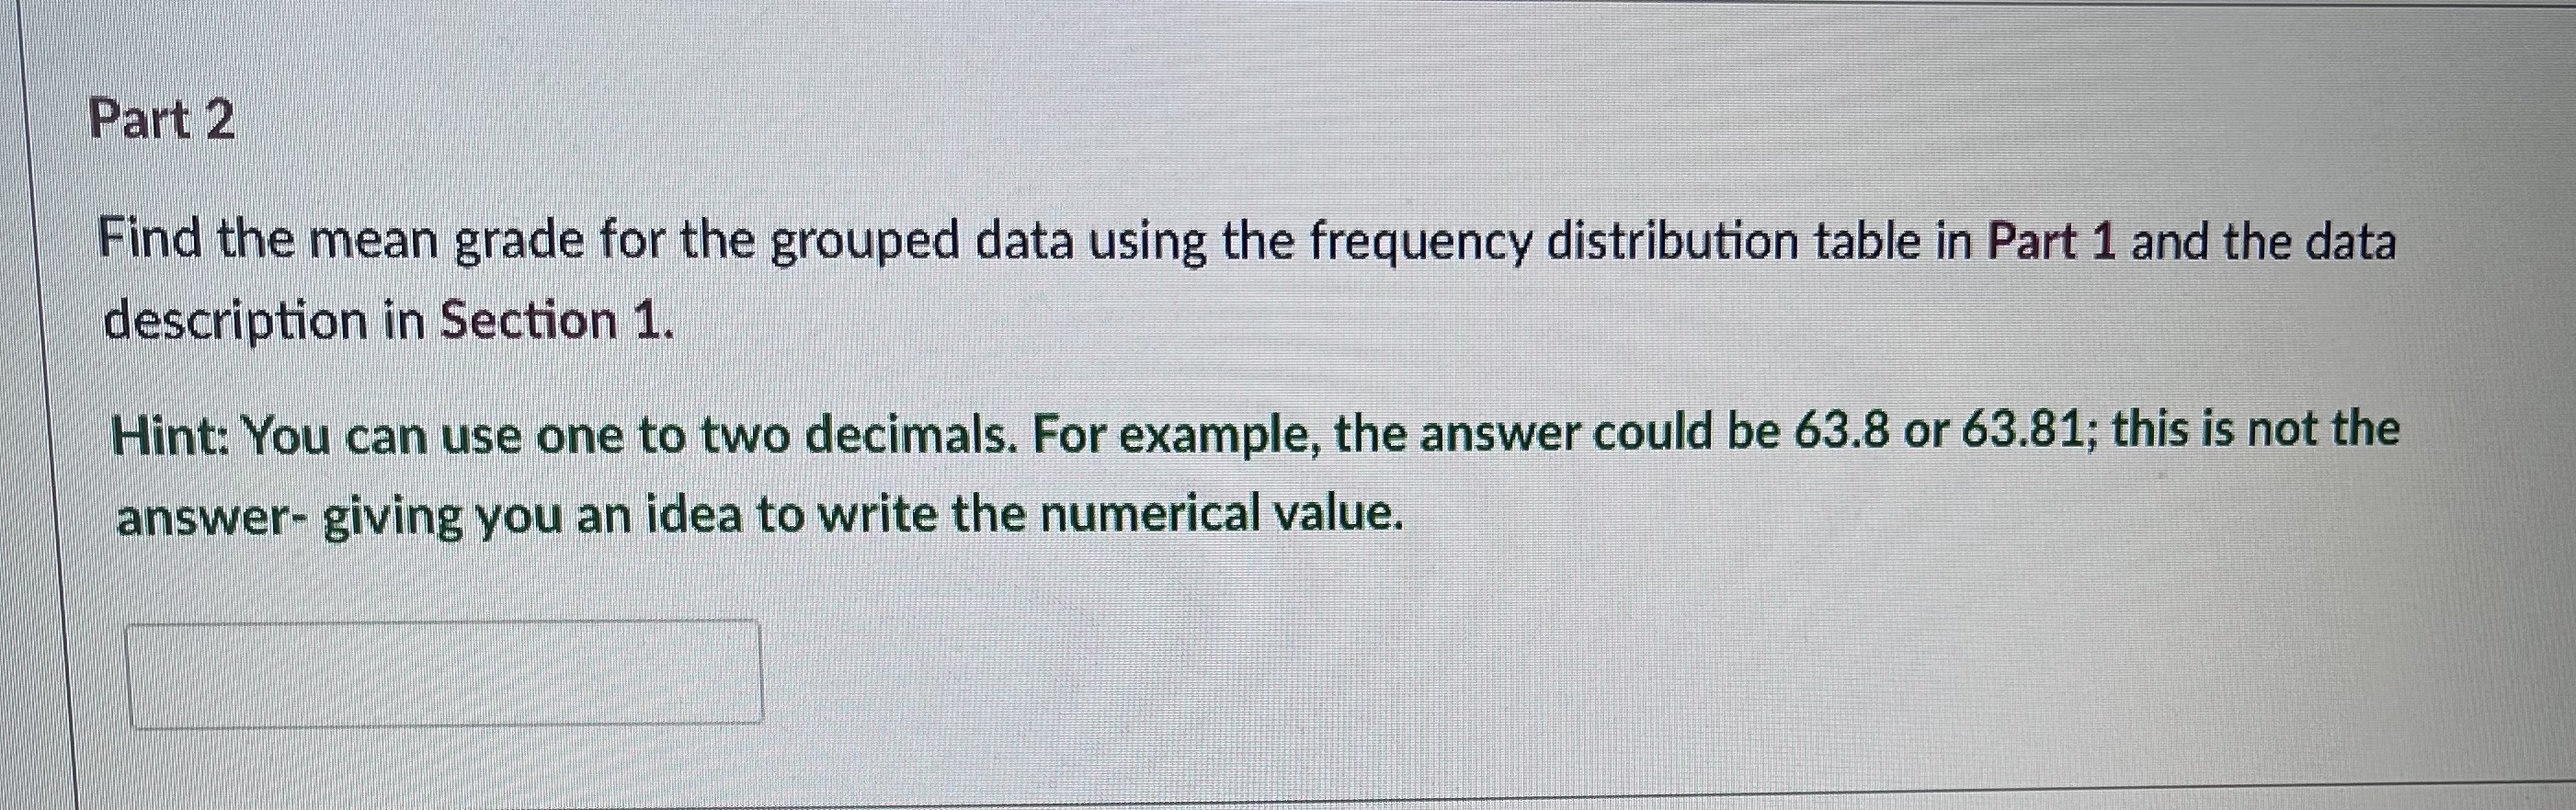
Part 4 For the data set find the standard deviation for the grouped data using the frequency distribution table. Hint: You can use one to two decimals. For example, the answer could be 10.8 or 10.81; this is not the answer- giving you an idea to write the numerical value.Part 5 Which graphical presentation would be the best choice to describe the midterm grade distribution in Section 1? Binomial distribution Bar graph Histogram Geometric distributionQuestion 1 2 pts Part 1 Write the class midpoints (class mark) of each group in the table below: Class Boundaries Frequency (f;) Class midpoints 9.5 - 19.5 3 19.5 -29.5 4 29.5-39.5 6 39.5-49.5 9 49.5 -59.5 16 59.5 - 69.5 9 69.5 -79.5 3 Hint: Use one decimal place and do not round any value to the nearest decimal. For example, the value of a class midpoint could be 20.5 or 29.0 (these are not answers to this question).Section 1 This frequency distribution table shows the grades scored by 50 students in the FRST 231 course some years ago. Class Boundaries Frequency (f;) 9.5 - 19.5 3 19.5 -29.5 4 29.5-39.5 6 39.5-49.5 9 49.5 -59.5 16 59.5 - 69.5 69.5 -79.5 Use the frequency distribution table to answer the following questions from Part 1 to Part 5Part 3 For the data set find the variance for the grouped data using the frequency distribution table. Hint: You can use one to two decimals. For example, the answer could be 100.8 or 100.81; this is not the answer- giving you an idea to write the numerical value.Part 2 Find the mean grade for the grouped data using the frequency distribution table in Part 1 and the data description in Section 1. Hint: You can use one to two decimals. For example, the answer could be 63.8 or 63.81; this is not the answer- giving you an idea to write the numerical value
Step by Step Solution
There are 3 Steps involved in it

Get step-by-step solutions from verified subject matter experts