

Question: Part 4 : Survey Data Cleaning and Re - Shaping with Power Query You are a data analyst at the Excellent Business School in Boston,
Part : Survey Data Cleaning and ReShaping with Power Query You are a data analyst at the Excellent Business School in Boston, and your supervisor has asked you to analyze survey data collected via Qualtrics in one of the school's Excel courses. You know the Qualtrics data are messy so you have dedicated time in your busy day to clean the data using Power Query before you begin to analyze it
Review the survey questions via the Survey Questions worksheet in Part of the Start File to familiarize yourself with the survey.
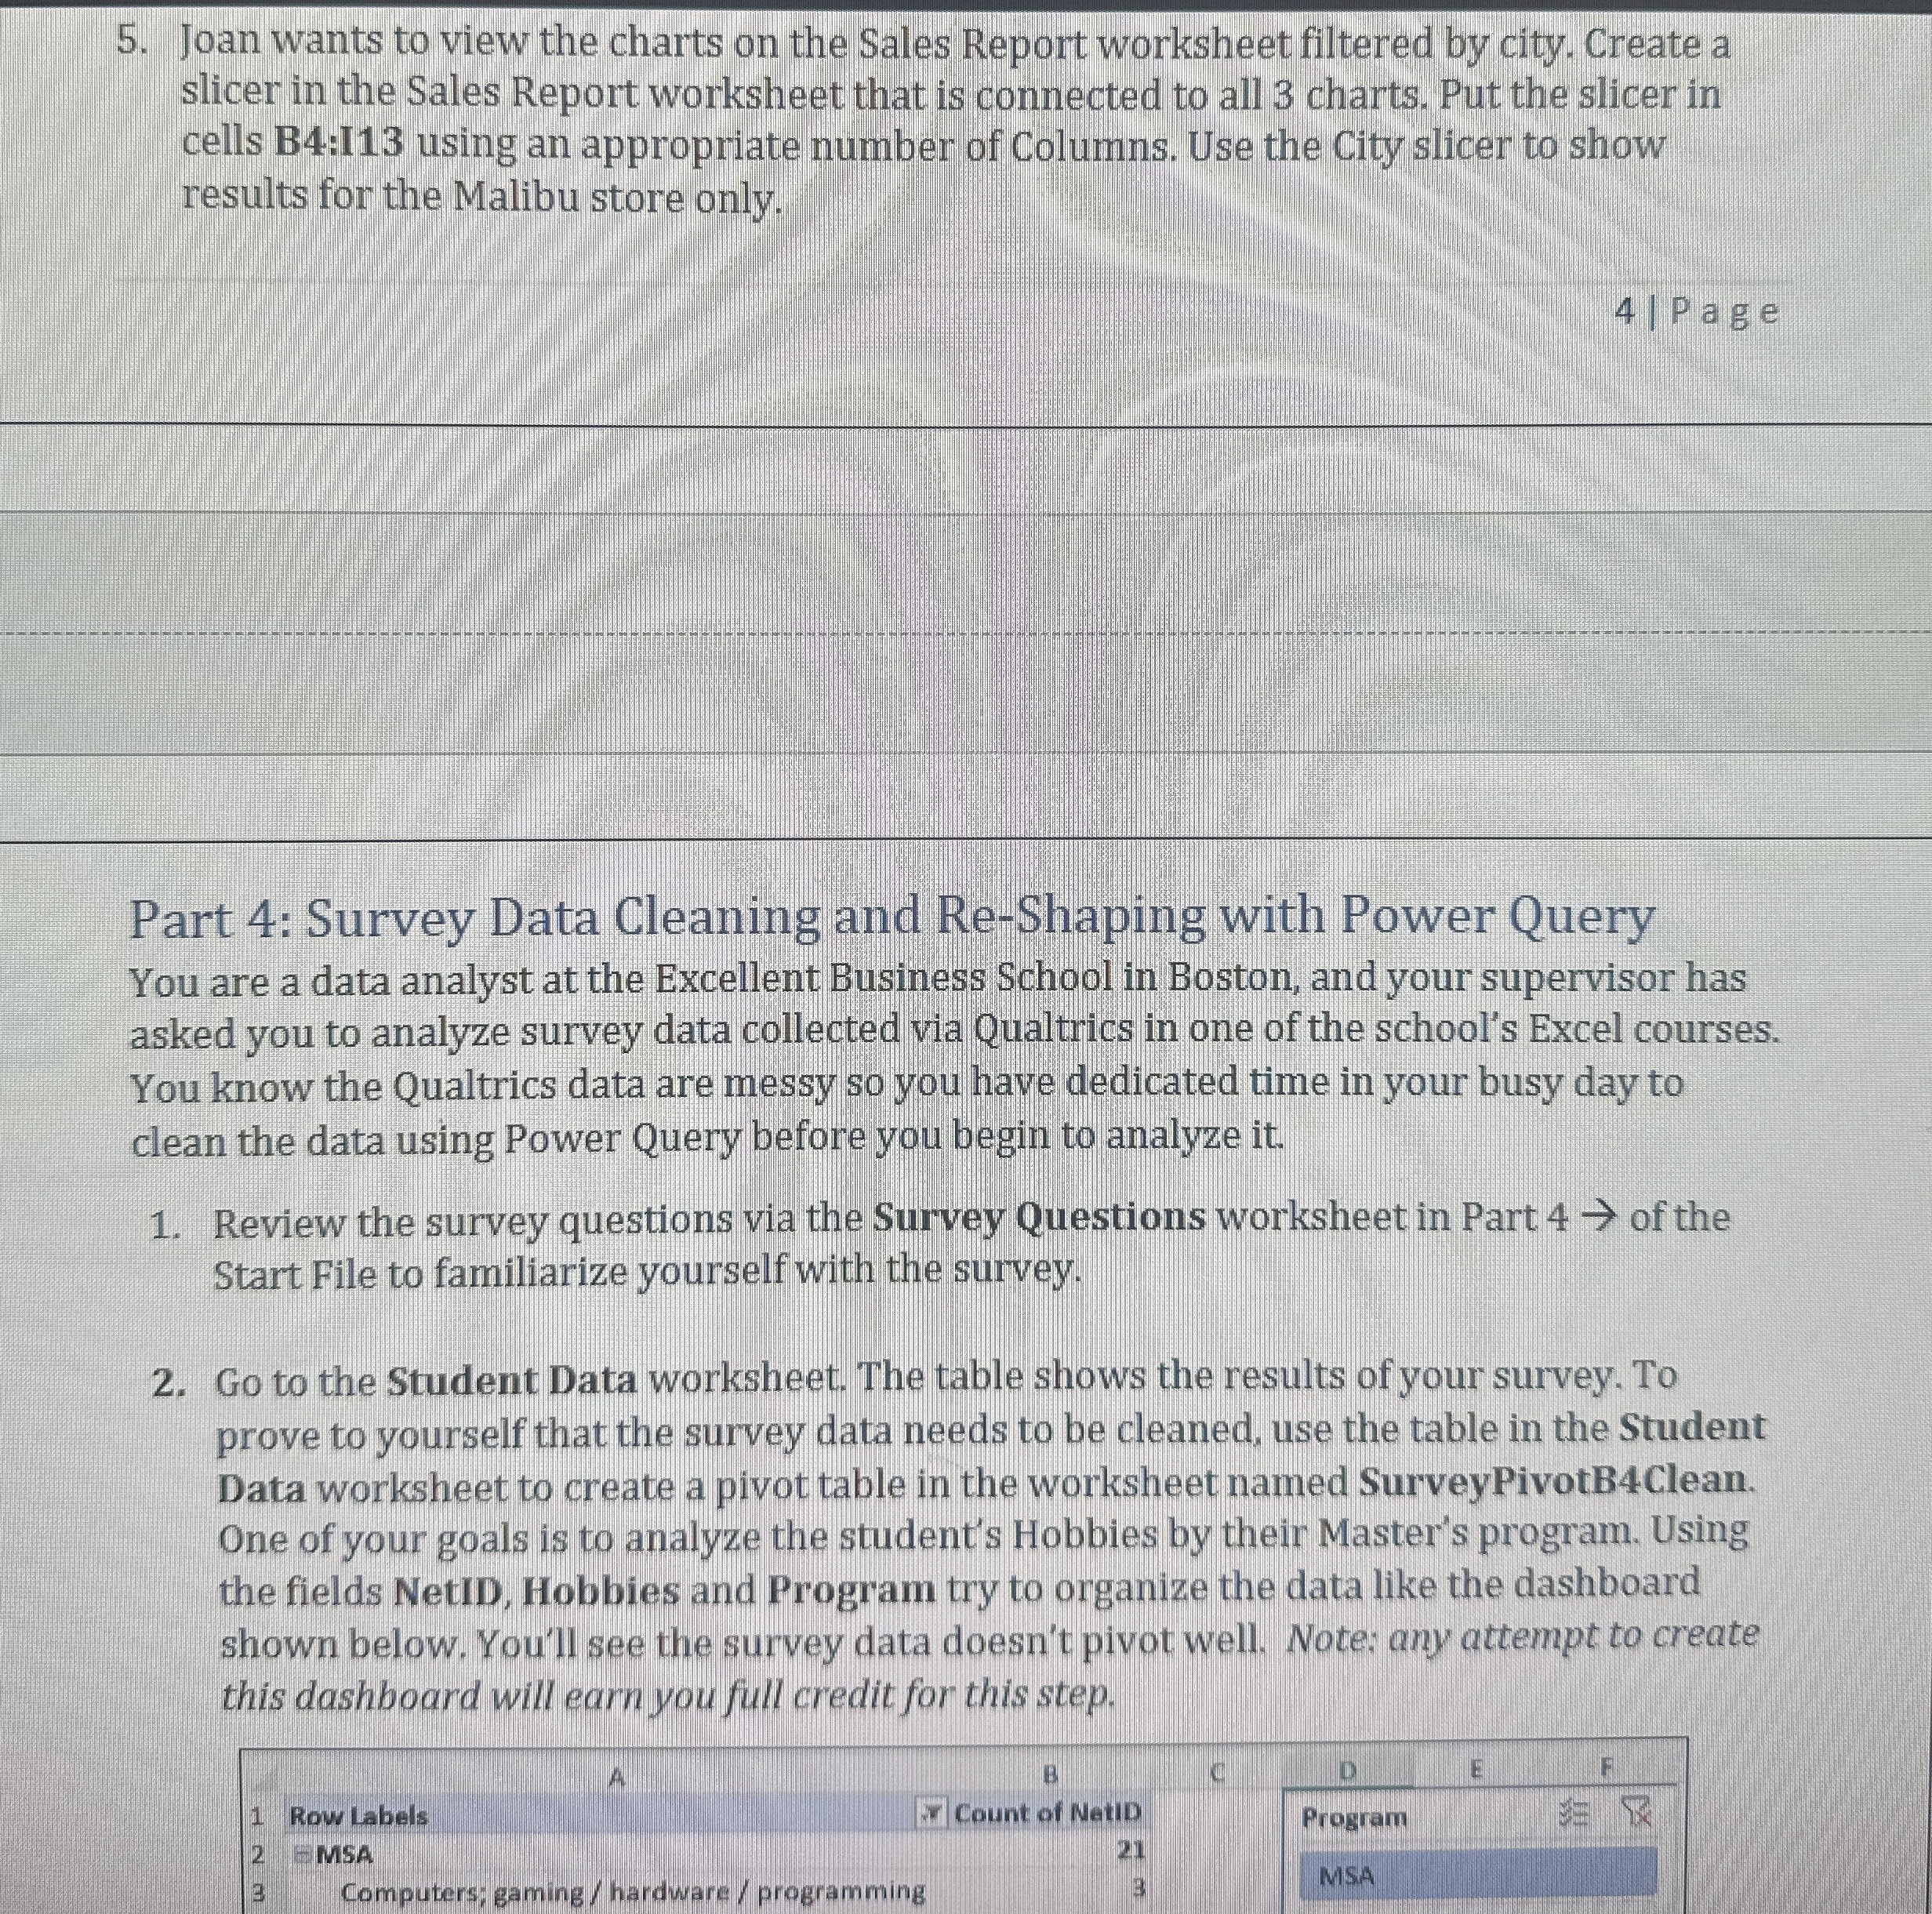
Go to the Student Data worksheet. The table shows the results of your survey. To prove to yourself that the survey data needs to be cleaned, use the table in the Student Data worksheet to create a pivot table in the worksheet named SurveyPivotBClean. One of your goals is to analyze the student's Hobbies by their Master's program. Using the fields NetID, Hobbies and Program try to organize the data like the dashboard shown below. You'll see the survey data doesn't pivot well. Note: any attempt to create this dashboard will earn you full credit for this step.
Step by Step Solution
There are 3 Steps involved in it
1 Expert Approved Answer
Step: 1 Unlock

Question Has Been Solved by an Expert!
Get step-by-step solutions from verified subject matter experts
Step: 2 Unlock
Step: 3 Unlock