

Question: PART 6 Risk and Return 354 Average Standard return deviation Distribution FIGURE 10.10 Series Historical average returns, standard deviations and frequency 11.7% 20.6% stocks 1926-2008
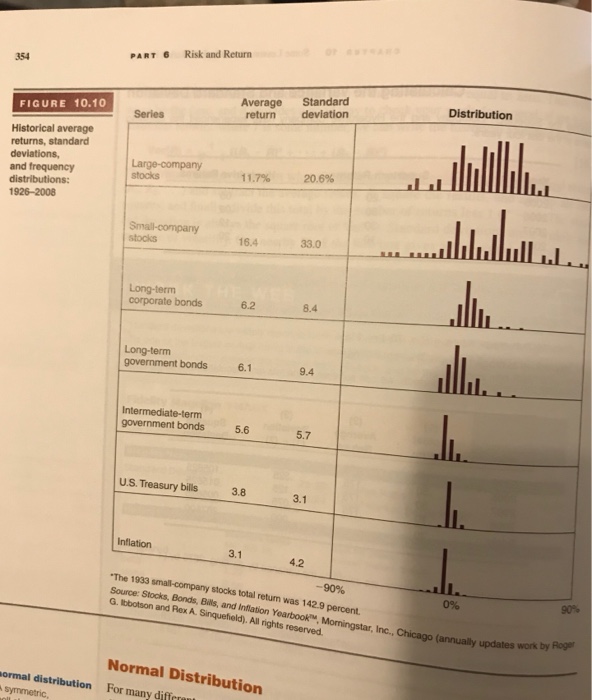
PART 6 Risk and Return 354 Average Standard return deviation Distribution FIGURE 10.10 Series Historical average returns, standard deviations and frequency 11.7% 20.6% stocks 1926-2008 Small-company 16.4 33.0 Long-term corporate bonds 6.2 8.4 Long-term government bonds 6.1 9.4 Intermediate-term government bonds 5.6 5.7 U.S. Treasury bills 3.8 3.1 3.1 4.2 -90% The 1933 small-company Source: Stocks, Bonds, Bils, and Inflation Yearbook, Morningstar, Inc. Chicago (annually G. Ibbotson and Rex A. Sinquefeld). All rights reserved stocks total return was 1429 percent. 90% 0% ly updates work by Roger Normal Distribution ormal distribution For many diffcru
Step by Step Solution
There are 3 Steps involved in it

Get step-by-step solutions from verified subject matter experts