

Question: ................. Part A 1. The following table summarized the age and blood pressure status of 474 randomly selected Canadian adults in 2017. At the 10%
.................
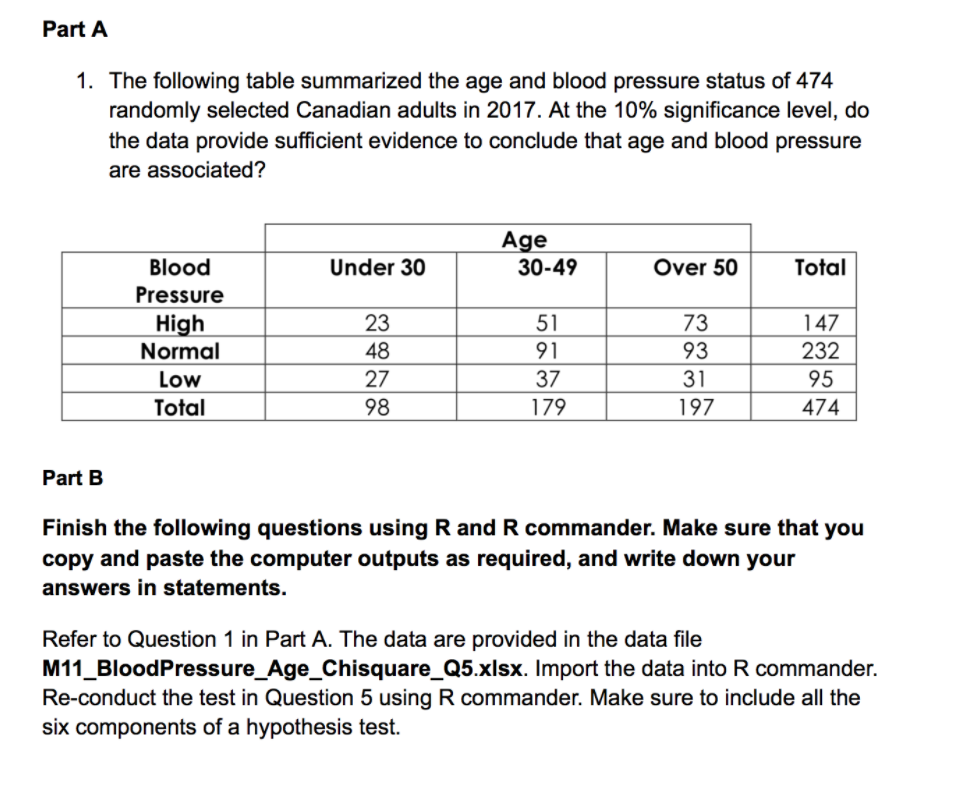
Part A 1. The following table summarized the age and blood pressure status of 474 randomly selected Canadian adults in 2017. At the 10% significance level, do the data provide sufficient evidence to conclude that age and blood pressure are associated? Age Blood Under 30 30-49 Over 50 Total Pressure High 23 51 73 147 Normal 48 91 93 232 Low 27 37 31 95 Total 98 179 197 474 Part B Finish the following questions using R and R commander. Make sure that you copy and paste the computer outputs as required, and write down your answers in statements. Refer to Question 1 in Part A. The data are provided in the data file M11_BloodPressure_Age_Chisquare_Q5.xisx. Import the data into R commander. Re-conduct the test in Question 5 using R commander. Make sure to include all the six components of a hypothesis test
Step by Step Solution
There are 3 Steps involved in it

Get step-by-step solutions from verified subject matter experts