

Question: Part A and b please 8 6 4 Log Power 2 0 -2 0 2 Log v (Hz) quency peak. b: Explain why the two
Part A and b please
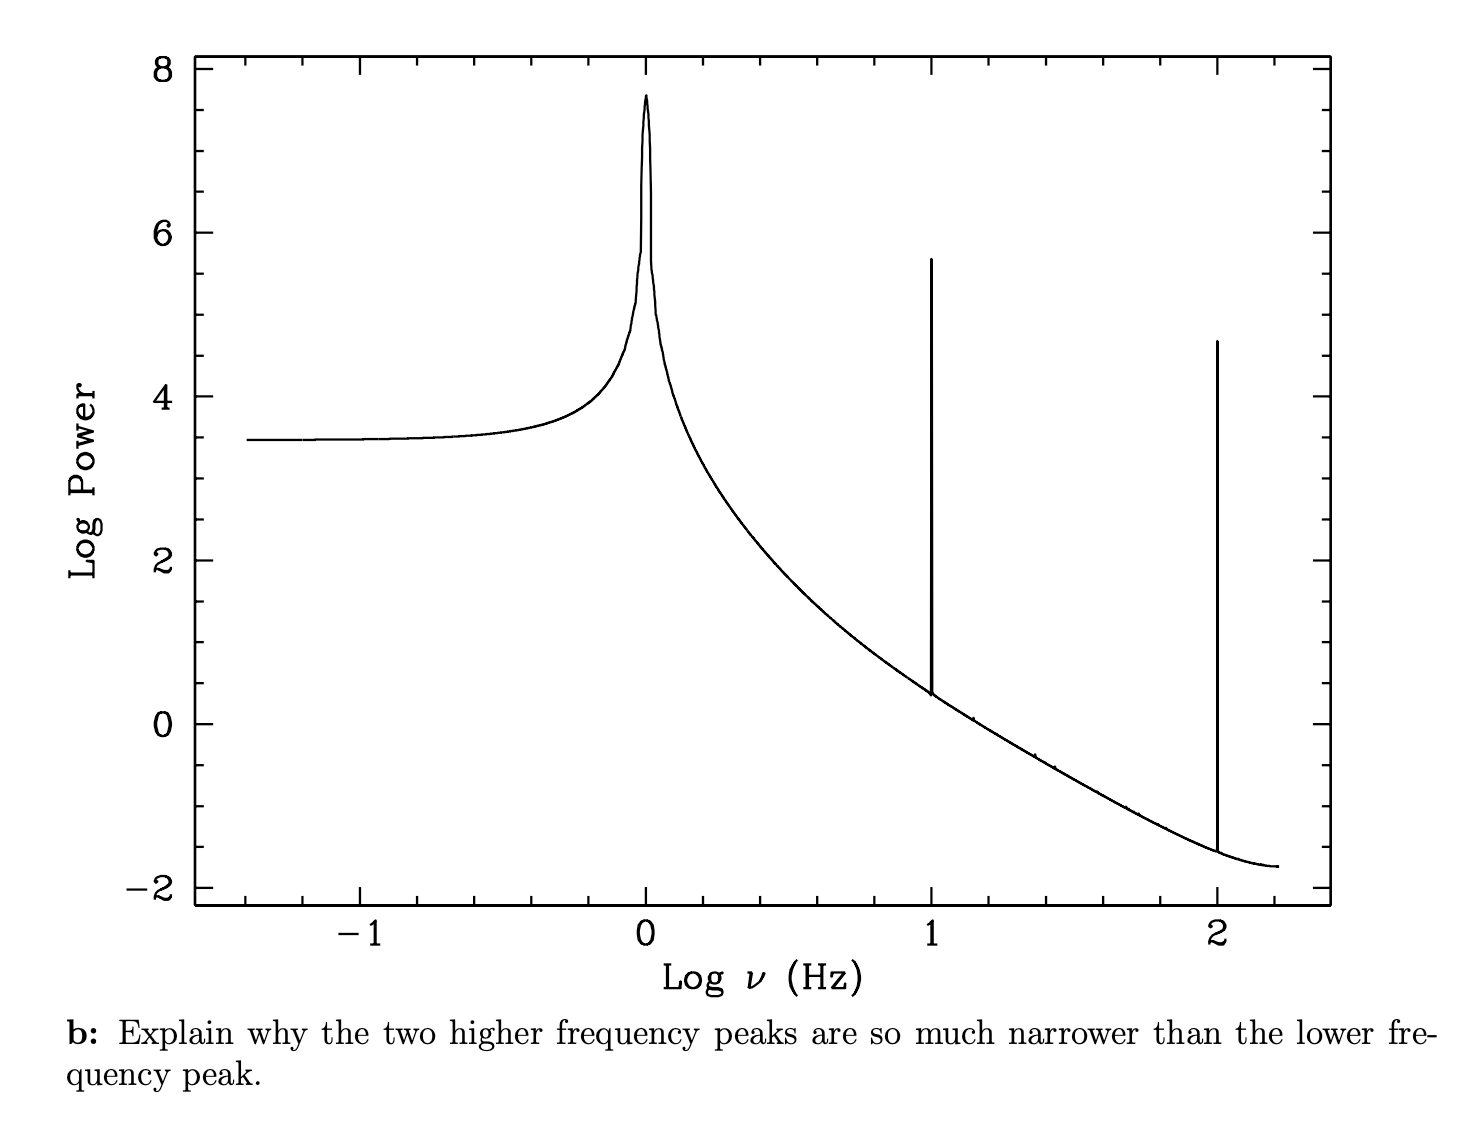
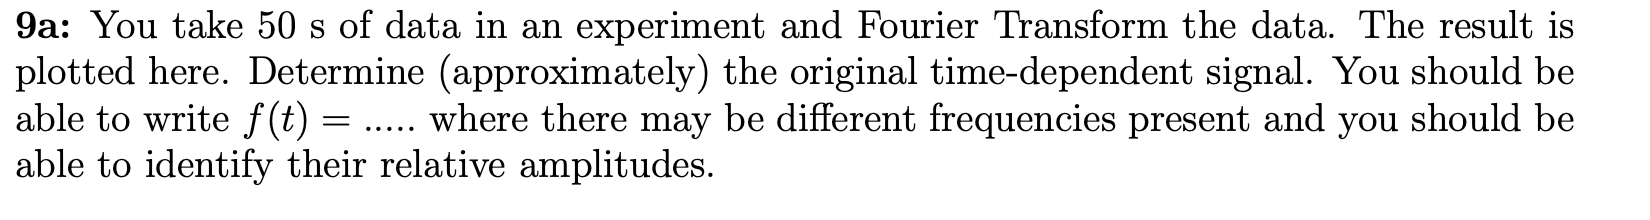
8 6 4 Log Power 2 0 -2 0 2 Log v (Hz) quency peak. b: Explain why the two higher frequency peaks are so much narrower than the lower fre-9a: You take 50 s of data in an experiment and Fourier Transform the data. The result is plotted here. Determine (approximately) the original timedependent signal. You should be able to write f (t) = ..... Where there may be different frequencies present and you should be able to identify their relative amplitudes
Step by Step Solution
There are 3 Steps involved in it
1 Expert Approved Answer
Step: 1 Unlock

Question Has Been Solved by an Expert!
Get step-by-step solutions from verified subject matter experts
Step: 2 Unlock
Step: 3 Unlock