

Question: part A and B with excel format Problem 15, part f. in Chapter 3 asks you to construct a five-year financial projection for Aquatic Supplies
part A and B with excel format
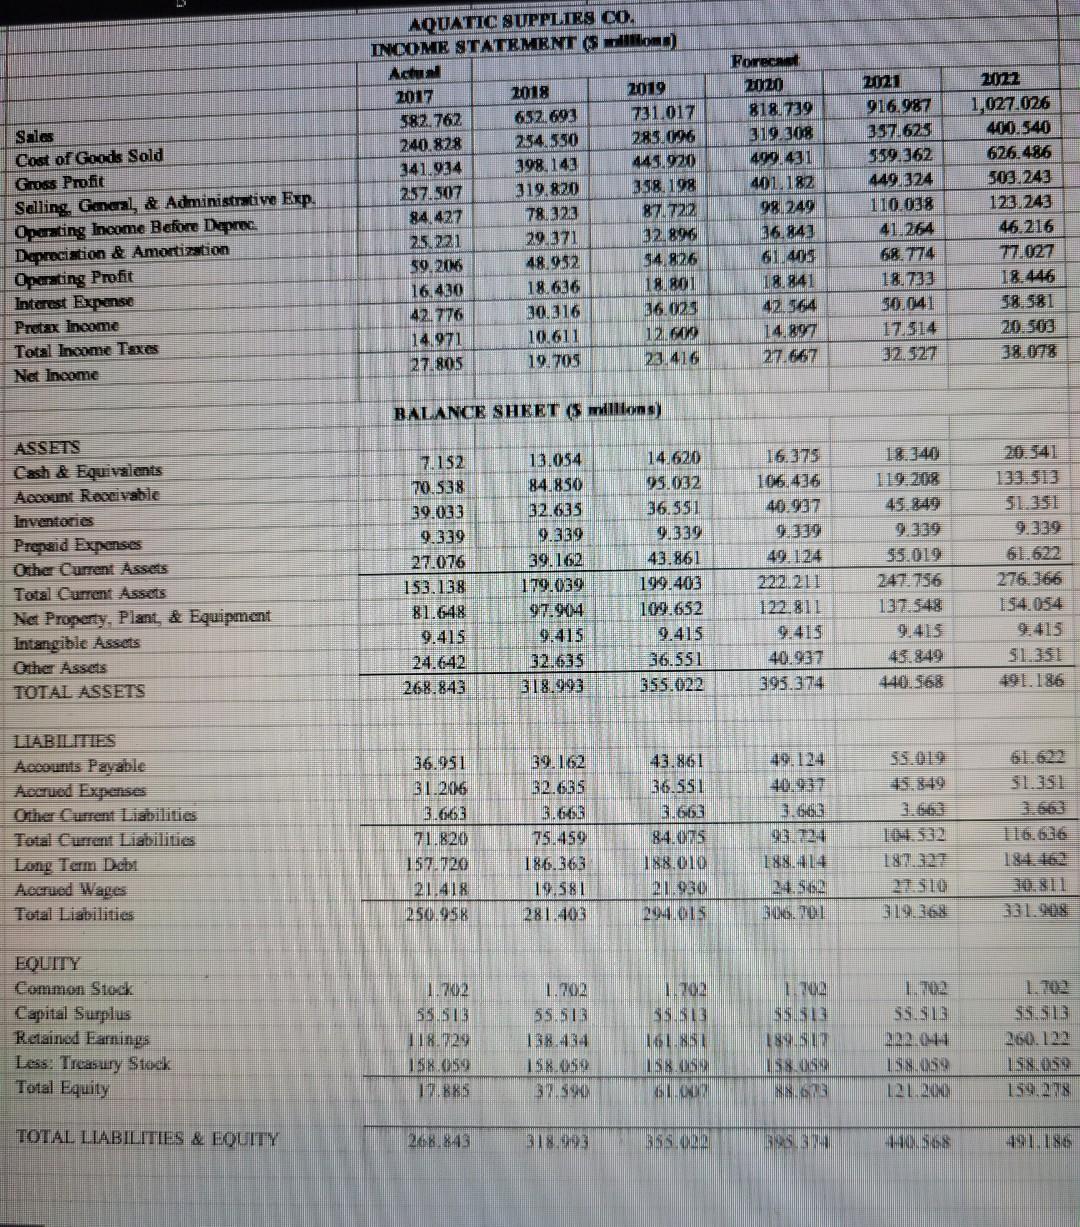
Problem 15, part f. in Chapter 3 asks you to construct a five-year financial projection for Aquatic Supplies beginning in 2018. The fiveyear projection appears below. Calculate Aquatic Supplies' sustainable and actual growth rates in these years. What do these numbers suggest to you? AOWATIC UPPLIRS CO. INCONIS STATENIRNT (s willion) Actual 2017 2018 2019 \begin{tabular}{|l|l|l|} \hline 2020 & 2021 & 202 \\ \hline \end{tabular} Sales Cost of Gaods Sold Gross Profit Selling Gacol, \& Administmive Exp. Oparting lacome Before Deproc. Deprocistion \& Amortization Opaating Profit Interest Expense Pretax lineome Total Income Taxes \begin{tabular}{|r|r|} \hline 916.987 & 1,027.026 \\ \hline 357.625 & 400.540 \\ \hline 559.362 & 626.486 \\ \hline 449.324 & 503.243 \\ \hline 110.038 & 123.243 \\ \hline 41.264 & 46.216 \\ \hline 68.774 & 77.027 \\ \hline 18.733 & 18.446 \\ \hline 50.041 & 58.581 \\ \hline 17.514 & 20.503 \\ \hline 32.527 & 38.078 \\ \hline \end{tabular} Net lneome BALANCE SHEET (5 millions) ASSETS Cash \& Equivilents Account Receivable Inventeries Prepgid Expenses Orher Current Assets Total Curcent Assets Net Property, Plant, \& Equipment Intangible Assets Oiner Assets TOTAL ASSETS \begin{tabular}{|r|r|r|r|r|r|} \hline 7.152 & 13.054 & 14.620 & 16.375 & 18.349 & 20.341 \\ \hline 70.538 & 84.850 & 95.032 & 106.436 & 119.208 & 133.513 \\ \hline 39.033 & 32.635 & 36.551 & 40.997 & 45.849 & 51.351 \\ \hline 9.339 & 9.339 & 9.339 & 9.339 & 9.339 & 9.339 \\ \hline 27.076 & 39.162 & 43.861 & 49.124 & 55.019 & 61.622 \\ \hline 153.138 & 179.039 & 199.403 & 222.211 & 247.756 & 276.366 \\ \hline 81.648 & 97.904 & 109.652 & 122.811 & 137.548 & 154.054 \\ \hline 9.415 & 9.415 & 9.415 & 9.415 & 9.415 & 9.415 \\ \hline 24.642 & 32.635 & 36.551 & 40.937 & 43.849 & 51.351 \\ \hline 268.843 & 318.993 & 355.022 & 395.374 & 440.568 & 491.186 \\ \hline \end{tabular} LABILITIES Acoounts Payable Accrued Expenses Orher Current Liabilities Total Current Liabilities Long Term Debt Accrued Wages Total Liabilities \begin{tabular}{|rrrrrrr} \hline 36.951 & 39.162 & 43.861 & 49.124 & 55.019 & 61.622 \\ 31.206 & 32.635 & 36.551 & 40.937 & 45.849 & 51.351 \\ 3.663 & 3.663 & 3.663 & 3.663 & 3.663 & 3.663 \\ \hline 71.820 & 75.459 & 84.075 & 93.724 & 104.532 & 116.636 \\ 157.720 & 186.363 & 188.010 & 188.414 & 187.327 & 184.462 \\ \hline 21.418 & 19.581 & 21.930 & 24.562 & 27.510 & 30.811 \\ \hline 250.958 & 281.403 & 294.015 & 306.701 & 319.368 & 331.968 \\ \hline \end{tabular} EQUIIY Common Stock Capital Surplus Retaind Eartings Less: Treasury Stock Total Equity TOTAL. LIABILITIES \& EQUTT \begin{tabular}{|rrrrrrr} 1.702 & 1.702 & 1.702 & 1.702 & 1.702 & 1.702 \\ 55.513 & 55.513 & 55.513 & 55.513 & 55.513 & 55.513 \\ 118.729 & 138.434 & 161.851 & 189.517 & 222.044 & 260.122 \\ 158.059 & 158.059 & 158.009 & 158.059 & 158.059 & 158.059 \\ \hline 17.885 & 37.590 & 61.007 & 88.673 & 121.200 & 159.278 \\ \hline 266.843 & 318.993 & 359.027 & 395.374 & 440.568 & 491.186 \\ \hline \end{tabular}
Step by Step Solution
There are 3 Steps involved in it

Get step-by-step solutions from verified subject matter experts