

Question: PART A. Answer Question 1 and any other two questions. (58 points total) We have selected a sample of sixteen executives who are working in
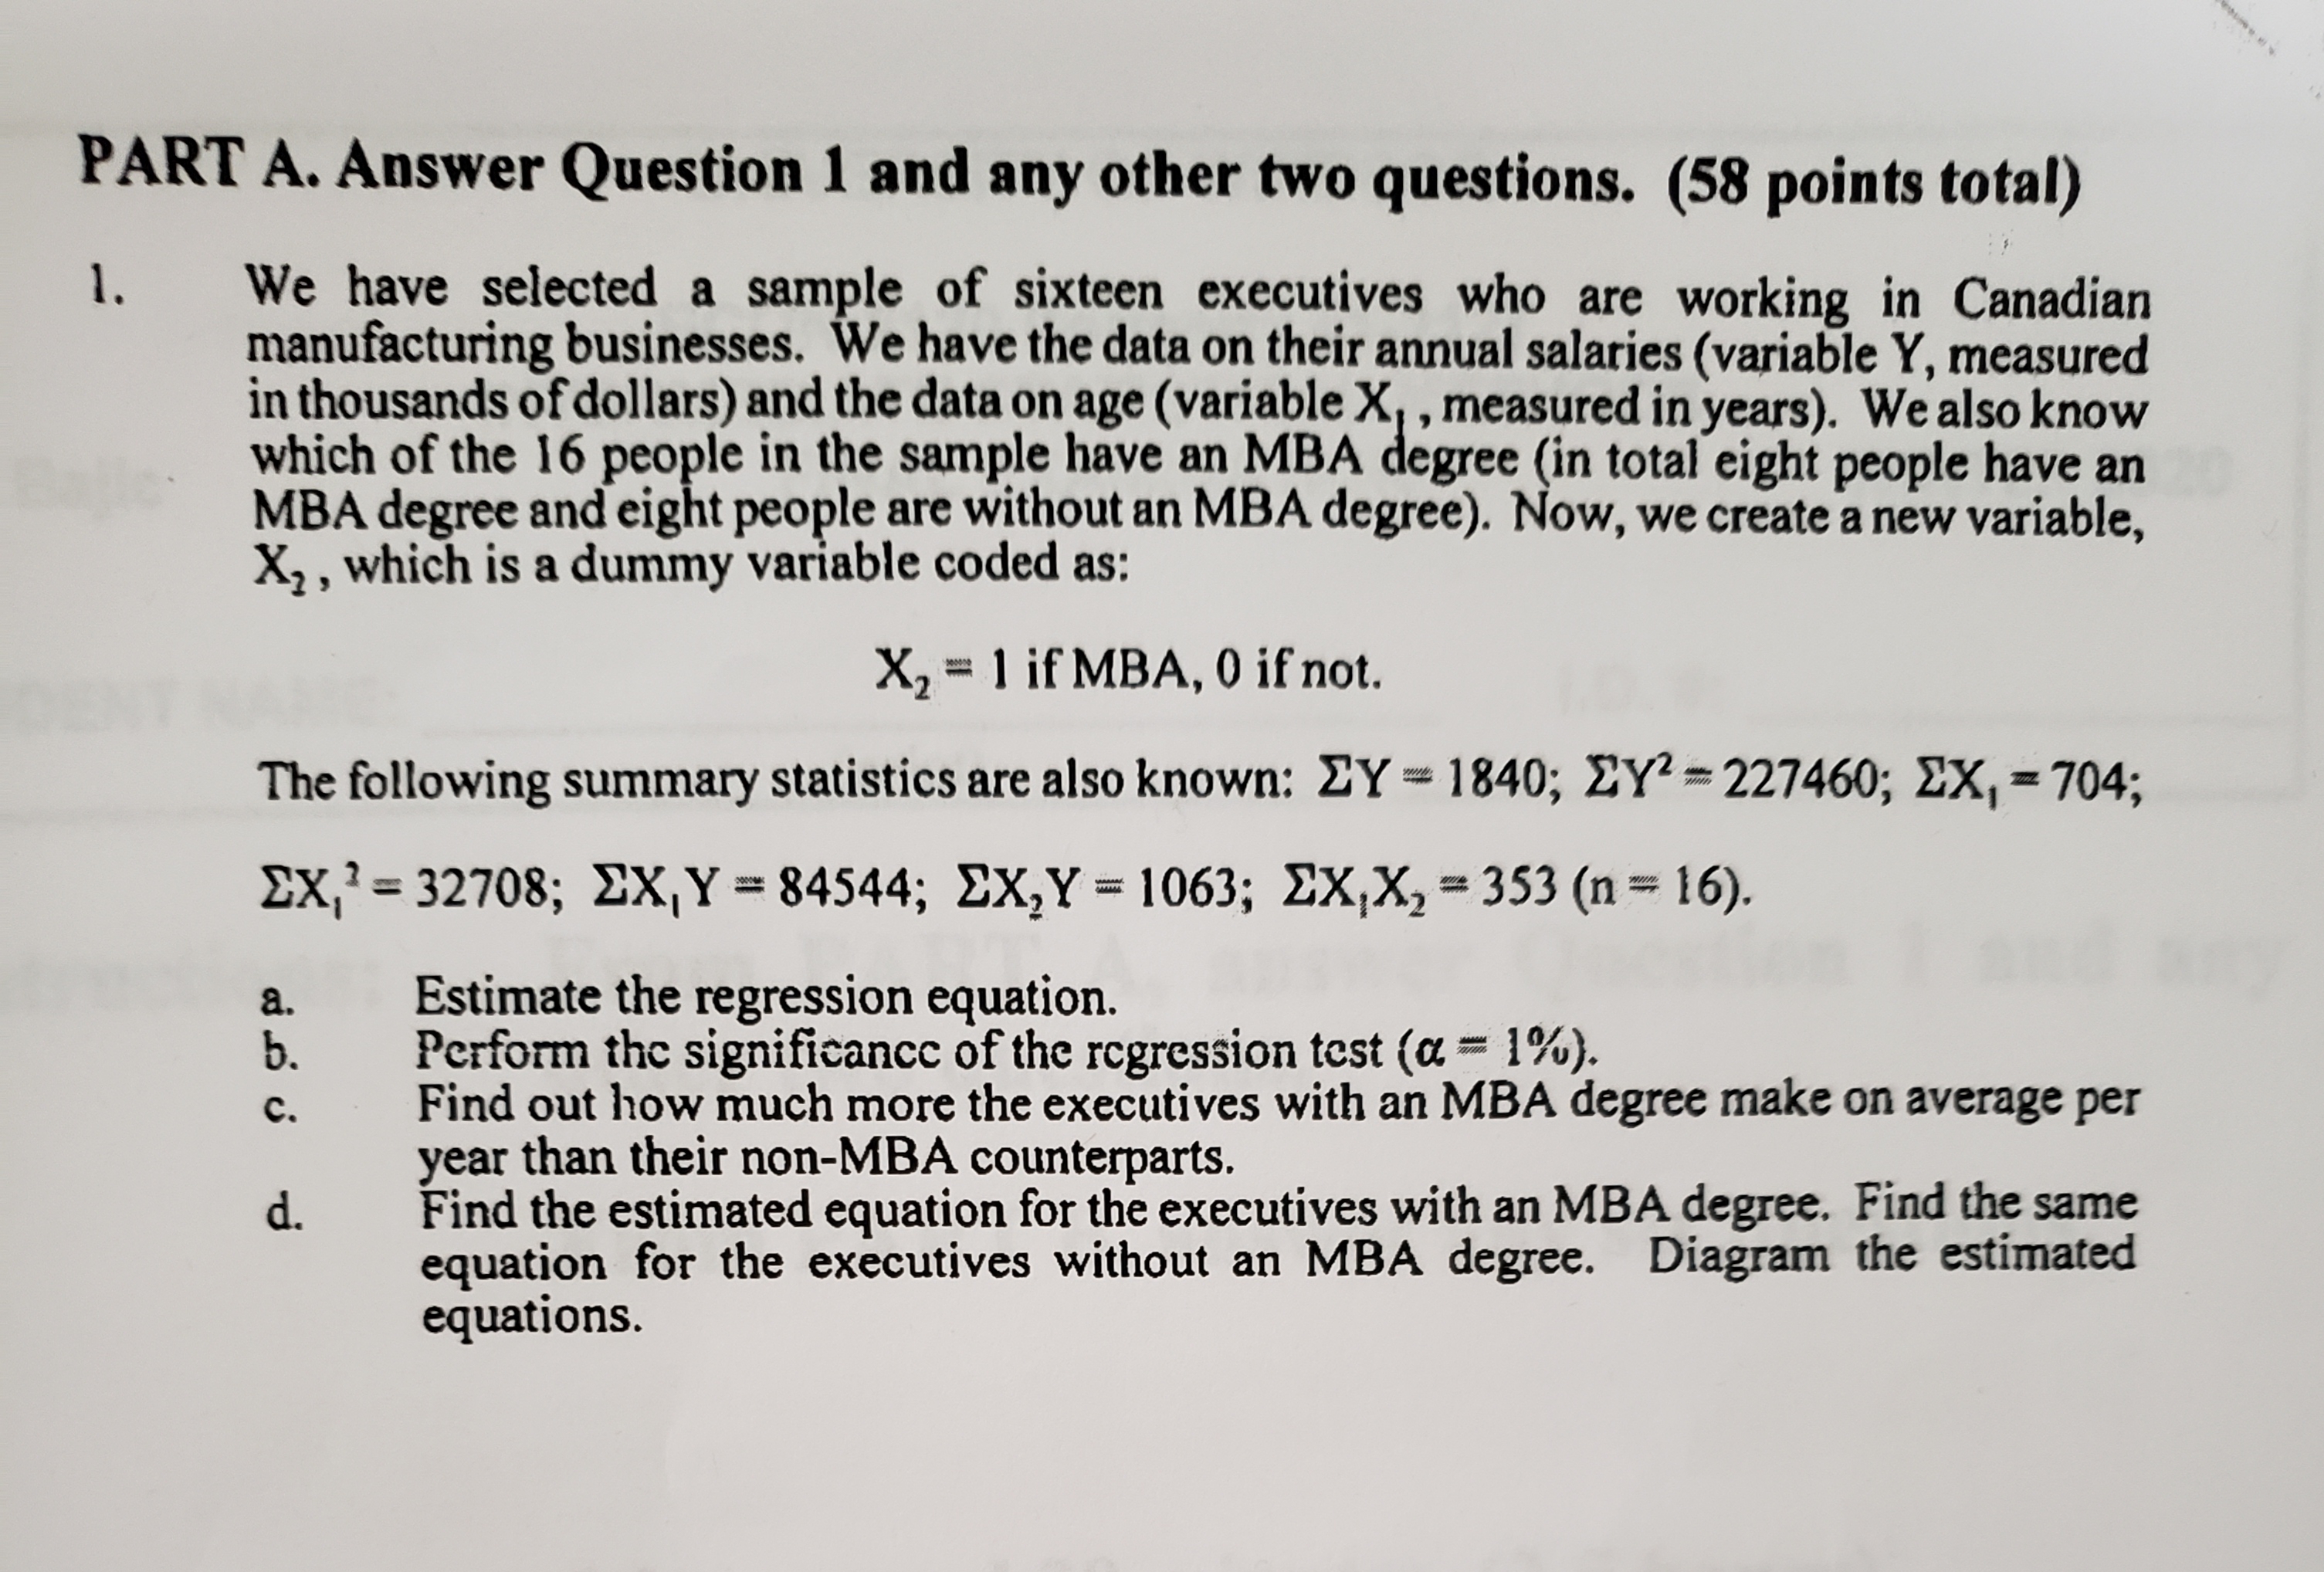
PART A. Answer Question 1 and any other two questions. (58 points total) We have selected a sample of sixteen executives who are working in Canadian manufacturing businesses. We have the data on their annual salaries (variable Y, measured in thousands of dollars) and the data on age ( variable X, , measured in years). We also know which of the 16 people in the sample have an MBA degree (in total eight people have an MBA degree and eight people are without an MBA degree). Now, we create a new variable, X2, which is a dummy variable coded as: X, = 1 if MBA, 0 if not. The following summary statistics are also known: ZY = 1840; EY? = 227460; EX, = 704; EX ? = 32708; EX,Y = 84544; EX,Y = 1063; EX,X, = 353 (n = 16). a. Estimate the regression equation. b. Perform the significance of the regression test (a = 1%). C . Find out how much more the executives with an MBA degree make on average per year than their non-MBA counterparts. d. Find the estimated equation for the executives with an MBA degree. Find the same equation for the executives without an MBA degree. Diagram the estimated equations
Step by Step Solution
There are 3 Steps involved in it

Get step-by-step solutions from verified subject matter experts