

Question: Part A B AND C (a). Define a MATLAB vector nx to be the time indices -3 Sn 7 and the MATLAB vector x to
 Part A B AND C
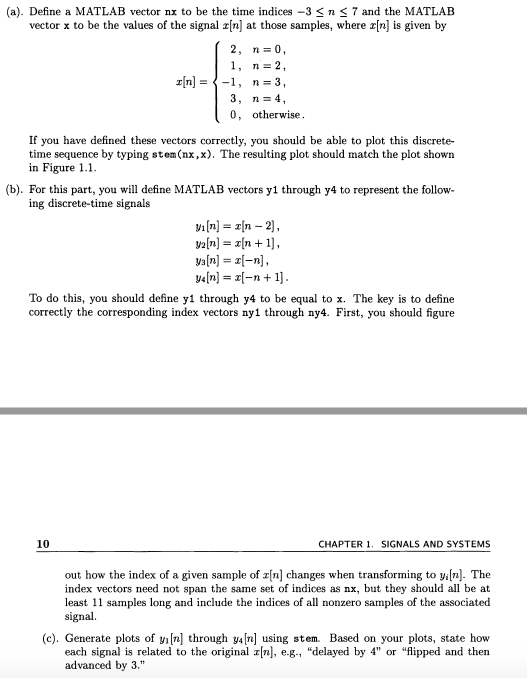
(a). Define a MATLAB vector nx to be the time indices -3 Sn 7 and the MATLAB vector x to be the values of the signal r[n] at those samples, where r[n] is given by r[n] -1, n-3, 0, otherwise If you have defined these vectors correctly, you should be able to plot this discrete- time sequence by typing stem(nx,x). The resulting plot should match the plot shown in Figure 1.1 (b). For this part, you will define MATLAB vectors y1 through y4 to represent the follow ing discrete-time signals To do this, you should define y1 through y4 to be equal to x. The key is to define correctly the corresponding index vectors ny1 through ny4. First, you should figure 10 CHAPTER 1. SIGNALS AND SYSTEMS out how the index of a given sample of z[n] changes when transforming to yiln). The index vectors need not span the same set of indices as nx, but they should all be at least 11 samples long and include the indices of all nonzero samples of the associated signal (c). Generate plots of yi[n] through ya[n] using stem. Based on your plots, state how each signal is related to the original x[n], e.g., "delayed by 4" or "flipped and then advanced by 3
Step by Step Solution
There are 3 Steps involved in it

Get step-by-step solutions from verified subject matter experts