

Calculate the followings statistics forstockreturn,market indexreturn, and T-bills returnduringperiod 1927-2016byusing the Excel functions. 1.Average return 2.Variance 3.Standard
Question:
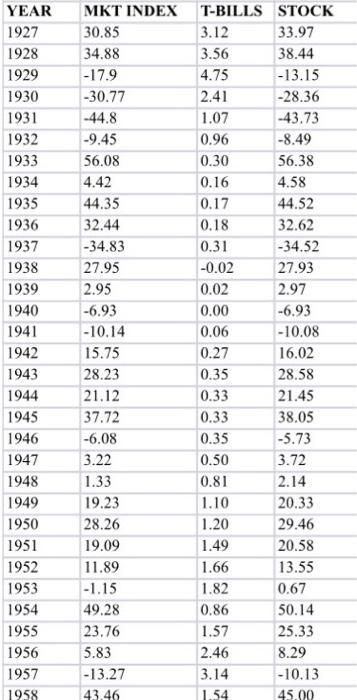
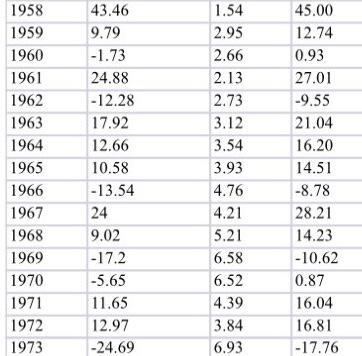
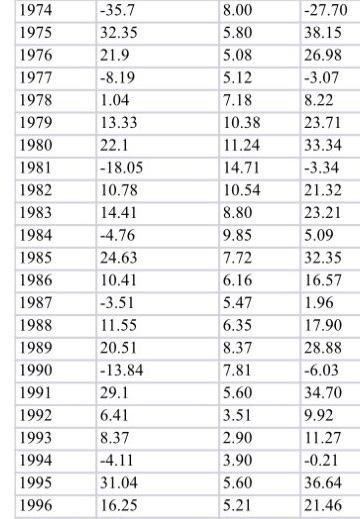
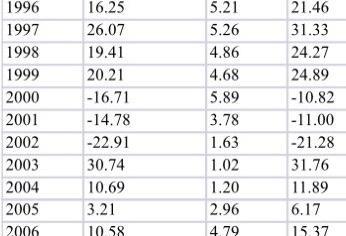
Calculate the followings statistics for stock return, market index return, and T-bills return during period 1927-2016 by using the Excel functions.
1. Average return
2. Variance
3. Standard deviation
Part B: Calculate the following statistics for stock and market returns each subperiod (1 to 4) and T-bills average return for each period by using the Excel functions.
1. For 1927-2016 period, average return, standard deviation
2. For 1927-1956 period, average return, standard deviation
3. For 1957-1987 period, average return, standard deviation
4. For 1988-2016 period, average return, standard deviation
5. Calculate the T-bills average returns for each period
Part C: Calculate the correlation between stock returns and market returns and then calculate the Beta for each period.
1. For 1927-2016 period, correlation , and Beta
2. For 1927-1956 period, correlation, and Beta
3. For 1957-1987 period, correlation, and Beta
4. For 1988-2016 period, correlation, and Beta
Part D: Calculate the expected rate of return from CAPM for each period by using the followings
1. Market average return for each period that you calculated in Part B
2. T-bills average return for each period ( proxy for the risk free rate) that you calculated in Part B
3. Beta that you calculated for each period in Part C.
Part E: Based on your calculation in Part A, B, and C,answer the following questions.
1. How stable Beta for each subperiod? Explain?
2. If it does, why expected rates of return from CAPM changessignificantly from period to period? Why?
Part F: Summary
Summarize what you learned from the history based on your analysis?
Expert Answer:
To calculate the statistics requested you can use the following Excel functions Part A 1 Average Return AVERAGE function 2 Variance VARS function 3 St... View the full answer

