

Question: Part (a): Expected Answer for 5.15: Additional Information: (Question 5.3 Answer): (Question 5.2 Answer): Part (b): Expected Answer for 5.16: Part (c): Expected Answer for
Part (a):
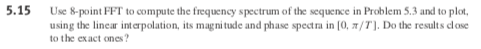
Expected Answer for 5.15:
Additional Information:
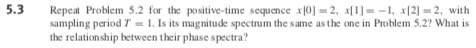
(Question 5.3 Answer):

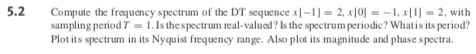
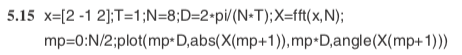
(Question 5.2 Answer):

Part (b):
![5.15 x=[2-1 2];T=1;N=8;D=2-pi/(N+T);X=fft(x,N); mp=0:N/2;plot(mp+D,abs(X(mp+1)), mp-D,angle(X(mp+1))) 5.3 Repeat Problem 5.2 for the positive-time](https://s3.amazonaws.com/si.experts.images/answers/2024/09/66dee4e53d0a1_62066dee4e4d36d4.jpg)
Expected Answer for 5.16:
![sequence x[0] = 2, x[1]= -1, x [2] = 2, with sampling](https://s3.amazonaws.com/si.experts.images/answers/2024/09/66dee4e5afef1_62166dee4e56276d.jpg)
Part (c):

Expected Answer for 5.19:

Please explain and give steps clearly. Thank you!
5.15 Use 8-point FFT to compute the frequency spectrum of the sequence in Problem 5.3 and to plot, using the lincar interpolation, its magnitude and phase spectra in 10, 7/T). Do the results close to the exact ones? 5.15 x=[2-1 2];T=1;N=8;D=2-pi/(N+T);X=fft(x,N); mp=0:N/2;plot(mp+D,abs(X(mp+1)), mp-D,angle(X(mp+1))) 5.3 Repeat Problem 5.2 for the positive-time sequence x[0] = 2, x[1]= -1, x [2] = 2, with sampling period T = 1. Is its magnitude spectrum the same as the one in Problem 5.2? What is the relationship between their phase spectra? 5.3 X1w) = -1*(-1+ 4 cos w). Its magnitude spectrum is the same as the one in Problem 5.2. Its phase spectrum differs from the one in Problem 5.2 by the linear phase -w. 5.2 Compute the frequency spectrum of the DT sequence x1-1) = 2, x[0] = -1, x[1) = 2, with sampling period 1 = 1. Is the spectrum real-valued? Is the spectrum periodic? Whatisits period? Plotits spectrum in its Nyquist frequency range. Also plot its magnitude and phase spectra. 5.2 -1 + 4 cos w. Real-valued and periodic with period 27. 5.16 Repeat Problem 5.15 using 1024-point FFT. 5.16 Replace N = 8 by N = 1024 in the program in Problem 5.15. 5.19 Repeat Problem 5.16 using 1024-point FFT. 5.19 Replace N = 8 by N = 1024 in the program in Problem 5.18. 5.15 Use 8-point FFT to compute the frequency spectrum of the sequence in Problem 5.3 and to plot, using the lincar interpolation, its magnitude and phase spectra in 10, 7/T). Do the results close to the exact ones? 5.15 x=[2-1 2];T=1;N=8;D=2-pi/(N+T);X=fft(x,N); mp=0:N/2;plot(mp+D,abs(X(mp+1)), mp-D,angle(X(mp+1))) 5.3 Repeat Problem 5.2 for the positive-time sequence x[0] = 2, x[1]= -1, x [2] = 2, with sampling period T = 1. Is its magnitude spectrum the same as the one in Problem 5.2? What is the relationship between their phase spectra? 5.3 X1w) = -1*(-1+ 4 cos w). Its magnitude spectrum is the same as the one in Problem 5.2. Its phase spectrum differs from the one in Problem 5.2 by the linear phase -w. 5.2 Compute the frequency spectrum of the DT sequence x1-1) = 2, x[0] = -1, x[1) = 2, with sampling period 1 = 1. Is the spectrum real-valued? Is the spectrum periodic? Whatisits period? Plotits spectrum in its Nyquist frequency range. Also plot its magnitude and phase spectra. 5.2 -1 + 4 cos w. Real-valued and periodic with period 27. 5.16 Repeat Problem 5.15 using 1024-point FFT. 5.16 Replace N = 8 by N = 1024 in the program in Problem 5.15. 5.19 Repeat Problem 5.16 using 1024-point FFT. 5.19 Replace N = 8 by N = 1024 in the program in Problem 5.18
Step by Step Solution
There are 3 Steps involved in it

Get step-by-step solutions from verified subject matter experts