

Question: Part A has I attached, I am looking for a chegg answer for part B and if possible, C Part A. The purpose of this
 Part A has I attached, I am looking for a chegg answer for part B and if possible, C
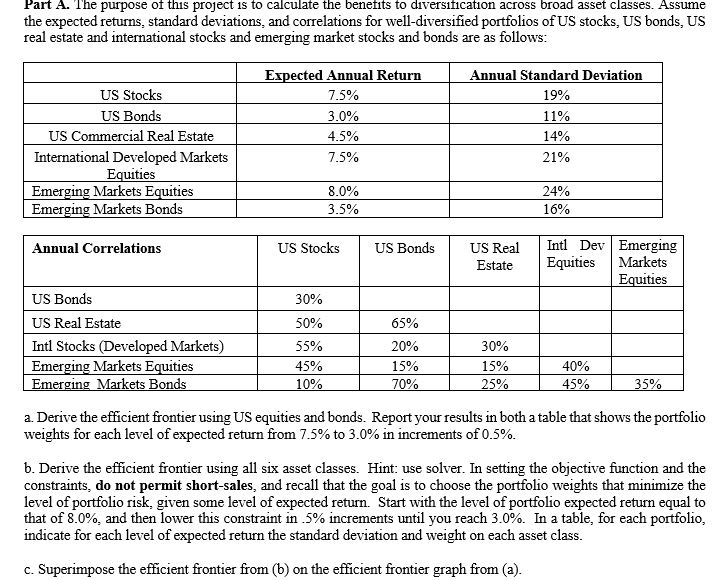
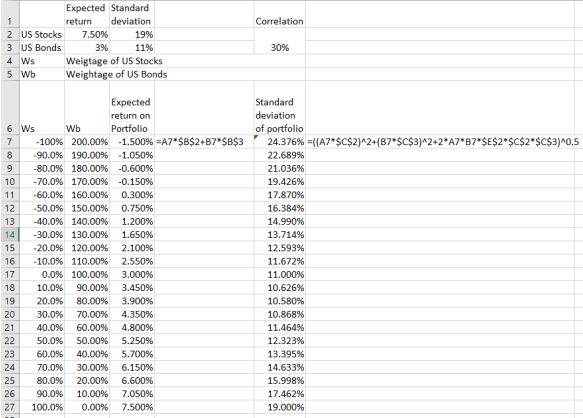
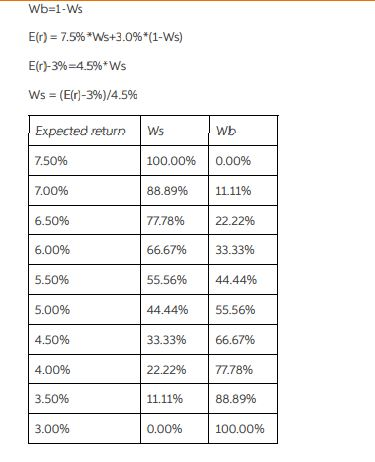
Part A. The purpose of this project is to calculate the benefits to diversification across broad asset classes. Assume the expected returns, standard deviations, and correlations for well-diversified portfolios of US stocks, US bonds, US real estate and international stocks and emerging market stocks and bonds are as follows: US Stocks US Bonds US Commercial Real Estate International Developed Markets Equities Emerging Markets Equities | Emerging Markets Bonds Expected Annual Return 7.5% 3.0% 4.5% 7.5% Annual Standard Deviation 19% 11% 14% 21% 8.0% 3.5% 24% 16% Annual Correlations US Stocks US Bonds US Real Estate Intl Dev Emerging Equities Markets Equities 65% US Bonds US Real Estate Intl Stocks (Developed Markets) Emerging Markets Equities | Emerging Markets Bonds 30% 50% 55% 45% 10% 30% 20% 15% 70% 15% 25% | | 40% 45% | 35% a. Derive the efficient frontier using US equities and bonds. Report your results in both a table that shows the portfolio weights for each level of expected return from 7.5% to 3.0% in increments of 0.5%. b. Derive the efficient frontier using all six asset classes. Hint: use solver. In setting the objective function and the constraints, do not permit short-sales, and recall that the goal is to choose the portfolio weights that minimize the level of portfolio risk, given some level of expected return. Start with the level of portfolio expected return equal to that of 8.0%, and then lower this constraint in 5% increments until you reach 3.0%. In a table, for each portfolio, indicate for each level of expected return the standard deviation and weight on each asset class. c. Superimpose the efficient frontier from (b) on the efficient frontier graph from (a). Correlation Expected Standard return deviation 2 US stocks 7.50% 19% 3 US Bonds 3% 11% Weigtage of US Stocks 5 Wb Weightage of US Bonds 30% 6 Ws 7 8 9 10 11 12 13 14 15 16 W -100% 90.0% -80.0% -70.0% -60.0% -50.0% -40.0% -30.0% -20.0% -10.0% 0.0% 10.0% 20.0% 30.0% 40.0% 50.0% 60.0% 70.0% 80.0% 90.0% 100.0% b 200.00% 190.00% 180.00% 170.00% 160.00% 150.00% 140.00% 130.00% 120.00% 110.00% 100.00% 90.00% 80.00% 70.00% 60.00% 50.00% 40.00% 30.00% 20.00% 10.00% 0.00% Expected return on Portfolio -1.500% =A7*$B$2+B7*$B$3 -1.050% -0.600% -0.150% 0.300% 0.750% 1.200% 1.650% 2.100% 2.550% 3.000% 3.450% 3.900% 4.350% 4.800% 5.250% 5.700% 6.150% 6.600% 7.050% 7.500% Standard deviation of portfolio 24.376% = {(A7*$C$2)^2+(B7*$C$3)^2+2*A7*B7"$E$2$C$2$C$3) 0.5 22.689% 21.036% 19.426% 17.870% 16.384% 14.990% 13.7149 12.593% 11.672% 11.000% 10.626% 10.580% 10.868% 11.464% 12.323% 13.395% 14.633% 15.998% 17.462% 19.000% 17 18 19 20 21 22 24 26 27 Wb=1-Ws E(r) = 7.5%*Ws+3.0%*(1-Ws) E(r)-3%=4.5%*Ws Ws = ((r)-3%)/4.5% Expected retum Ws 100.00% Wb 0.00% 7.50% 7.00% 88.89% 11.11% 6.50% 77.78% 22.22% 6.00% 66.67% 33.33% 5.50% 55.56% 44.44% 5.00% 44.44% 55.56% 4.50% 33.33% 66.67% 4.00% 22.22% 77.78% 3.50% 11.11% 88.89% 3.00% 0.00% 100.00% Part A. The purpose of this project is to calculate the benefits to diversification across broad asset classes. Assume the expected returns, standard deviations, and correlations for well-diversified portfolios of US stocks, US bonds, US real estate and international stocks and emerging market stocks and bonds are as follows: US Stocks US Bonds US Commercial Real Estate International Developed Markets Equities Emerging Markets Equities | Emerging Markets Bonds Expected Annual Return 7.5% 3.0% 4.5% 7.5% Annual Standard Deviation 19% 11% 14% 21% 8.0% 3.5% 24% 16% Annual Correlations US Stocks US Bonds US Real Estate Intl Dev Emerging Equities Markets Equities 65% US Bonds US Real Estate Intl Stocks (Developed Markets) Emerging Markets Equities | Emerging Markets Bonds 30% 50% 55% 45% 10% 30% 20% 15% 70% 15% 25% | | 40% 45% | 35% a. Derive the efficient frontier using US equities and bonds. Report your results in both a table that shows the portfolio weights for each level of expected return from 7.5% to 3.0% in increments of 0.5%. b. Derive the efficient frontier using all six asset classes. Hint: use solver. In setting the objective function and the constraints, do not permit short-sales, and recall that the goal is to choose the portfolio weights that minimize the level of portfolio risk, given some level of expected return. Start with the level of portfolio expected return equal to that of 8.0%, and then lower this constraint in 5% increments until you reach 3.0%. In a table, for each portfolio, indicate for each level of expected return the standard deviation and weight on each asset class. c. Superimpose the efficient frontier from (b) on the efficient frontier graph from (a). Correlation Expected Standard return deviation 2 US stocks 7.50% 19% 3 US Bonds 3% 11% Weigtage of US Stocks 5 Wb Weightage of US Bonds 30% 6 Ws 7 8 9 10 11 12 13 14 15 16 W -100% 90.0% -80.0% -70.0% -60.0% -50.0% -40.0% -30.0% -20.0% -10.0% 0.0% 10.0% 20.0% 30.0% 40.0% 50.0% 60.0% 70.0% 80.0% 90.0% 100.0% b 200.00% 190.00% 180.00% 170.00% 160.00% 150.00% 140.00% 130.00% 120.00% 110.00% 100.00% 90.00% 80.00% 70.00% 60.00% 50.00% 40.00% 30.00% 20.00% 10.00% 0.00% Expected return on Portfolio -1.500% =A7*$B$2+B7*$B$3 -1.050% -0.600% -0.150% 0.300% 0.750% 1.200% 1.650% 2.100% 2.550% 3.000% 3.450% 3.900% 4.350% 4.800% 5.250% 5.700% 6.150% 6.600% 7.050% 7.500% Standard deviation of portfolio 24.376% = {(A7*$C$2)^2+(B7*$C$3)^2+2*A7*B7"$E$2$C$2$C$3) 0.5 22.689% 21.036% 19.426% 17.870% 16.384% 14.990% 13.7149 12.593% 11.672% 11.000% 10.626% 10.580% 10.868% 11.464% 12.323% 13.395% 14.633% 15.998% 17.462% 19.000% 17 18 19 20 21 22 24 26 27 Wb=1-Ws E(r) = 7.5%*Ws+3.0%*(1-Ws) E(r)-3%=4.5%*Ws Ws = ((r)-3%)/4.5% Expected retum Ws 100.00% Wb 0.00% 7.50% 7.00% 88.89% 11.11% 6.50% 77.78% 22.22% 6.00% 66.67% 33.33% 5.50% 55.56% 44.44% 5.00% 44.44% 55.56% 4.50% 33.33% 66.67% 4.00% 22.22% 77.78% 3.50% 11.11% 88.89% 3.00% 0.00% 100.00%
Step by Step Solution
There are 3 Steps involved in it

Get step-by-step solutions from verified subject matter experts