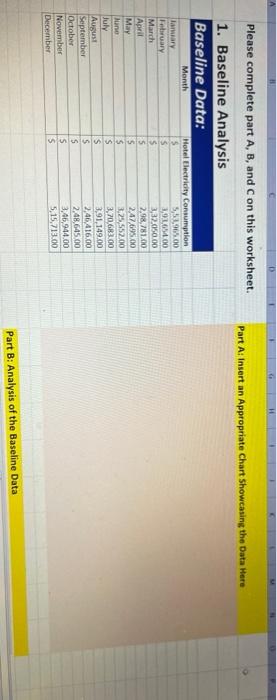
Question: Part A Insert an Appropriate Chart Showcasing the Data Here Please complete part A, B, and on this worksheet. 1. Baseline Analysis Baseline Data: Month

Part A Insert an Appropriate Chart Showcasing the
Part A Insert an Appropriate Chart Showcasing the Data Here Please complete part A, B, and on this worksheet. 1. Baseline Analysis Baseline Data: Month anary February March April May une July August September October November December Hotel Electricity Consumption $ 5,521,965.00 $ 3,91,65400 $ 3,32.050.00 5 2,98,781.00 $ 2.47.695.00 $ 2,25.552.00 $ 3,70.683.00 s 3,91,149,00 s 2,46,416.00 S 2,48,645.00 s 3,46,944.00 $ 5,15,713.00 Part B: Analysis of the Baseline Data H Part B: Analysis of the Baseline Data Part C: Identify and explain 2 Recommendations Based upon the Data

Step by Step Solution

There are 3 Steps involved in it

1 Expert Approved Answer
Step: 1 Unlock blur-text-image
Question Has Been Solved by an Expert!

Get step-by-step solutions from verified subject matter experts

Step: 2 Unlock
Step: 3 Unlock

Students Have Also Explored These Related General Management Questions!