

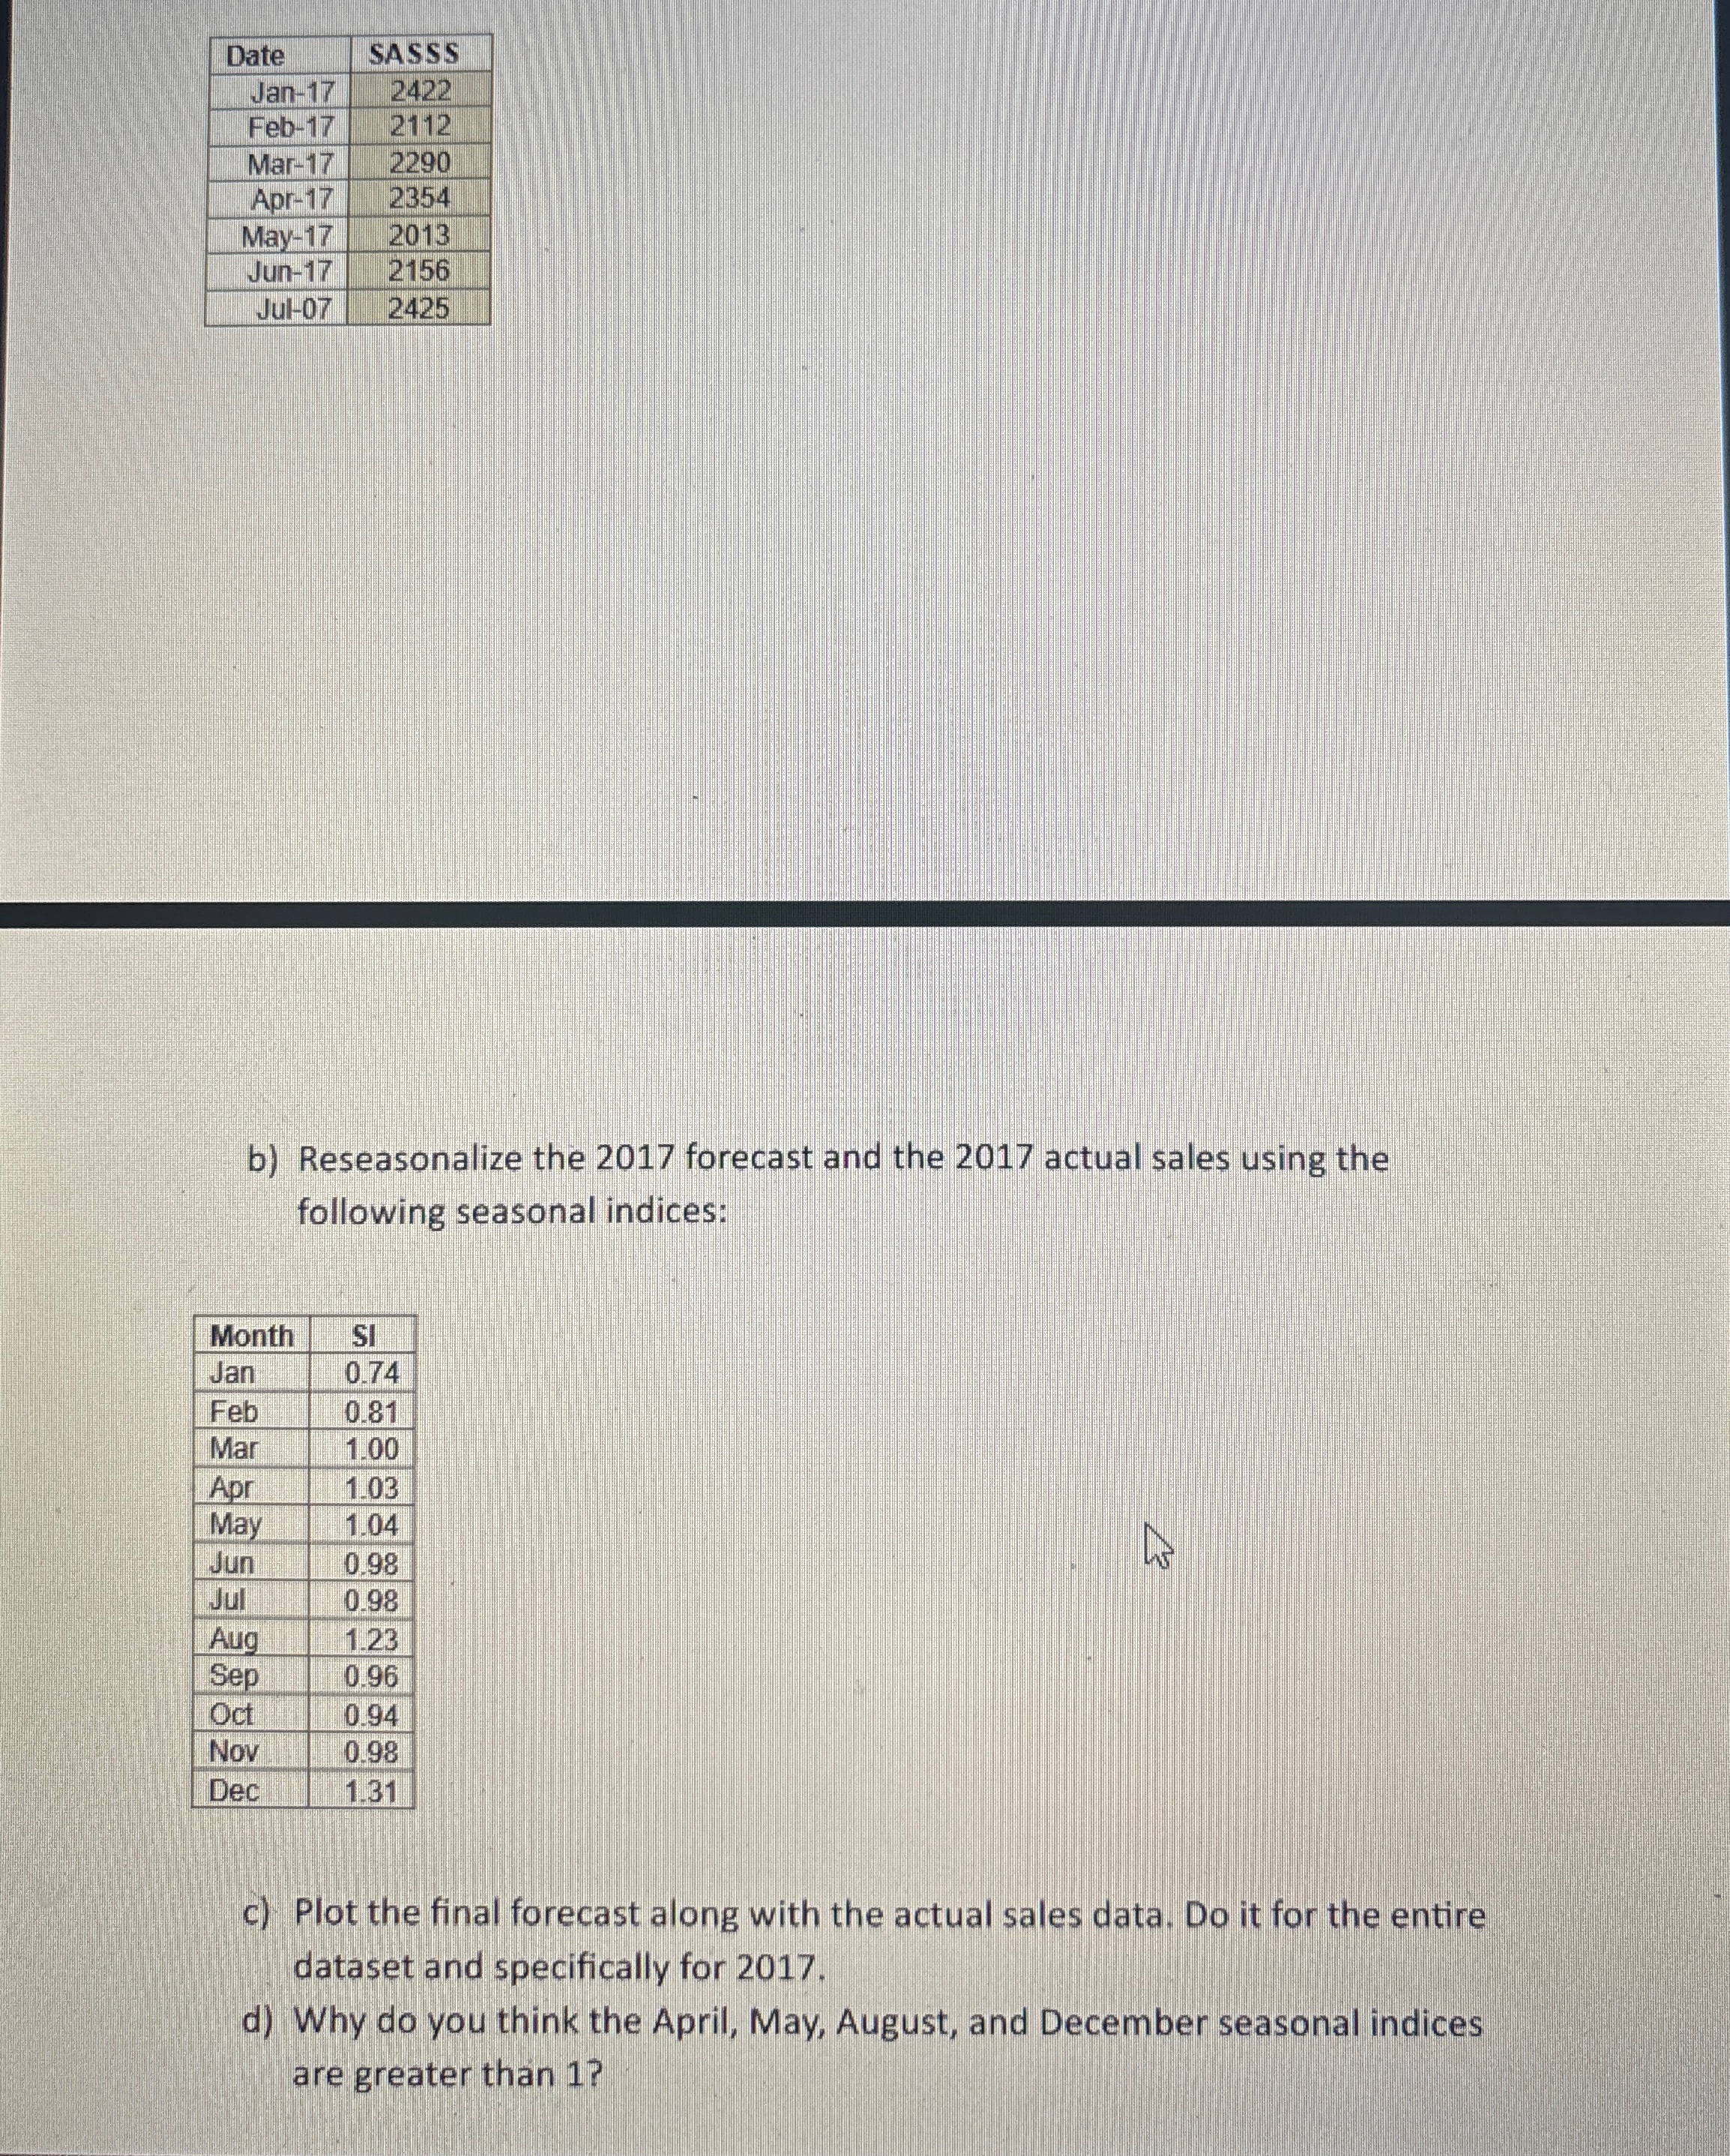
Question: Part A ) Make a linear trend forecast for SASSS through the first seven months of 2 0 1 7 . Given that the actual
Part A Make a linear trend forecast for SASSS through the first seven months of Given that the actual seasonally adjusted value for were as shown on the top chart, calculate the MAPE for those seven months of Calculate the MAPE for the entire dataset. After then complete parts B and C with steps and formulas for Excel please and thank you!
Step by Step Solution
There are 3 Steps involved in it
1 Expert Approved Answer
Step: 1 Unlock

Question Has Been Solved by an Expert!
Get step-by-step solutions from verified subject matter experts
Step: 2 Unlock
Step: 3 Unlock